Particulate inorganic carbon
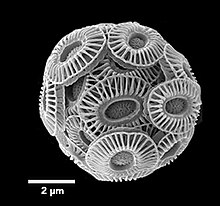
[8] This biologically fixed carbon is used as a protective coating for many planktonic species (coccolithophores, foraminifera) as well as larger marine organisms (mollusk shells).
Calcium carbonate often forms remarkable deposits that can then be raised onto land through tectonic motion as in the case with the White Cliffs of Dover in Southern England.
[5] Due to their abundance, coccolithophores have significant implications on carbonate chemistry, in the surface waters they inhabit and in the ocean below: they provide a large mechanism for the downward transport of CaCO3.
[24][28] A whiting event is a phenomenon that occurs when a suspended cloud of fine-grained calcium carbonate precipitates in water bodies, typically during summer months, as a result of photosynthetic microbiological activity or sediment disturbance.
Generally, they are thought to result from either bottom sediment re-suspension or by increased activity of certain microscopic life such as phytoplankton.
[35][36][31] Because whiting events affect aquatic chemistry, physical properties, and carbon cycling, studying the mechanisms behind them holds scientific relevance in various ways.
[41] The Great Calcite Belt, defined as an elevated particulate inorganic carbon (PIC) feature occurring alongside seasonally elevated chlorophyll a in austral spring and summer in the Southern Ocean,[42] plays an important role in climate fluctuations,[43][44] accounting for over 60% of the Southern Ocean area (30–60° S).
For example, more understanding is needed of how light and iron availability or temperature and pH interact to control phytoplankton biogeography.
[47][48][49] Hence, if model parameterizations are to improve to provide accurate predictions of biogeochemical change, a multivariate understanding of the full suite of environmental drivers is required.
[50][41] The Southern Ocean has often been considered as a microplankton-dominated (20–200 μm) system with phytoplankton blooms dominated by large diatoms and Phaeocystis sp.
and Thalassiosira spp., tend to dominate numerically, whereas large diatoms with higher silicic acid requirements (e.g., Fragilariopsis kerguelensis) are generally more abundant south of the polar front.
[59] High abundances of nanoplankton (coccolithophores, small diatoms, chrysophytes) have also been observed on the Patagonian Shelf [52] and in the Scotia Sea.
[59][51][52][60] Rather, the focus has often been on the larger and noncalcifying species in the Southern Ocean due to sample preservation issues (i.e., acidified Lugol’s solution dissolves calcite, and light microscopy restricts accurate identification to cells > 10 μm.
[66][67][68] The subtropical front (at approximately 10 °C) acts as the northern boundary of the GCB and is associated with a sharp increase in PIC southwards.
[45] These fronts divide distinct environmental and biogeochemical zones, making the GCB an ideal study area to examine controls on phytoplankton communities in the open ocean.
The GCB is clearly observed in satellite imagery [42] spanning from the Patagonian Shelf [69][70] across the Atlantic, Indian, and Pacific oceans and completing Antarctic circumnavigation via the Drake Passage.
[73][74] As a result, there has been profound interest in these calcifying algae, boosted by their major role in the global carbon cycle.
In short, the PIC:POC ratio is a key characteristic required to understand and predict the impact of climate change on the global ocean carbon cycle.


B) and D) Particles similar to the Ca carbonates described to precipitate on the cell surface of cultured marine bacteria .
E) and F) Particles with one flat surface suggesting that they are formed on a surface or interface.
G and H) Particles with rhombohedral shape.
I) and J) Baton like particles resembling Bahaman ooids .

