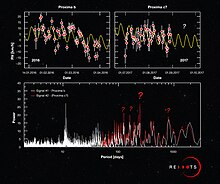
Periodogram
In signal processing, a periodogram is an estimate of the spectral density of a signal.
The term was coined by Arthur Schuster in 1898.
[1] Today, the periodogram is a component of more sophisticated methods (see spectral estimation).
It is the most common tool for examining the amplitude vs frequency characteristics of FIR filters and window functions.
FFT spectrum analyzers are also implemented as a time-sequence of periodograms.
There are at least two different definitions in use today.
[2] One of them involves time-averaging,[3] and one does not.
[4] Time-averaging is also the purview of other articles (Bartlett's method and Welch's method).
This article is not about time-averaging.
The definition of interest here is that the power spectral density of a continuous function,
is the Fourier transform of its auto-correlation function (see Cross-correlation theorem, Spectral density, and Wiener–Khinchin theorem):
For sufficiently small values of parameter T, an arbitrarily-accurate approximation for X(f) can be observed in the region
which is precisely determined by the samples x(nT) that span the non-zero duration of x(t) (see Discrete-time Fourier transform).
And for sufficiently large values of parameter N,
can be evaluated at an arbitrarily close frequency by a summation of the form:
allows this to be written very simply in terms of a Discrete Fourier transform:
{\displaystyle X_{1/T}\left({\tfrac {k}{NT}}\right)=\underbrace {\sum _{n}x_{_{N}}[n]\cdot e^{-i2\pi {\frac {kn}{N}}},} _{\text{DFT}}\quad \scriptstyle {{\text{(sum over any }}n{\text{-sequence of length }}N)},}
is a periodic summation:
When evaluated for all integers, k, between 0 and N-1, the array:
{\displaystyle S\left({\tfrac {k}{NT}}\right)=\left|\sum _{n}x_{_{N}}[n]\cdot e^{-i2\pi {\frac {kn}{N}}}\right|^{2}}
[4][5][6] When a periodogram is used to examine the detailed characteristics of an FIR filter or window function, the parameter N is chosen to be several multiples of the non-zero duration of the x[n] sequence, which is called zero-padding (see § Sampling the DTFT).
[A] When it is used to implement a filter bank, N is several sub-multiples of the non-zero duration of the x[n] sequence (see § Sampling the DTFT).
One of the periodogram's deficiencies is that the variance at a given frequency does not decrease as the number of samples used in the computation increases.
It does not provide the averaging needed to analyze noiselike signals or even sinusoids at low signal-to-noise ratios.
Window functions and filter impulse responses are noiseless, but many other signals require more sophisticated methods of spectral estimation.
Two of the alternatives use periodograms as part of the process: Periodogram-based techniques introduce small biases that are unacceptable in some applications.
Other techniques that do not rely on periodograms are presented in the spectral density estimation article.