Protein contact map
Contact maps provide a more reduced representation of a protein structure than its full 3D atomic coordinates.
[4] Several statistical methods exist to extract from a multiple sequence alignment such coupled residue pairs: observed versus expected frequencies of residue pairs (OMES);[5] the McLachlan Based Substitution correlation (McBASC);[6] statistical coupling analysis; Mutual Information (MI) based methods;[7] and recently direct coupling analysis (DCA).
[8][9] Machine learning algorithms have been able to enhance MSA analysis methods, especially for non-homologous proteins (ie.
In representations of the HB plot, characteristic patterns of secondary structure elements can be recognised easily, as follows: The cytochrome P450s (P450s) are xenobiotic-metabolizing membrane-bound heme-containing enzymes that use molecular oxygen and electrons from NADPH cytochrome P450 reductase to oxidize their substrates.
The comparison of the open and closed structures of CYP2B4 structures reveals large-scale conformational rearrangement between the two states, with the greatest conformational change around the residues 215-225, which is widely open in ligand-free state and shut after ligand binding; and the region around loop C near the heme.
Examining the HB plot of the closed and open state of CYP2B4 revealed that the rearrangement of tertiary hydrogen bonds was in excellent agreement with the current knowledge of the cytochrome P450 catalytic cycle.
For the electron transfer a conformational change occurs that triggers interaction of the P450 with the NADPH cytochrome P450 reductase.
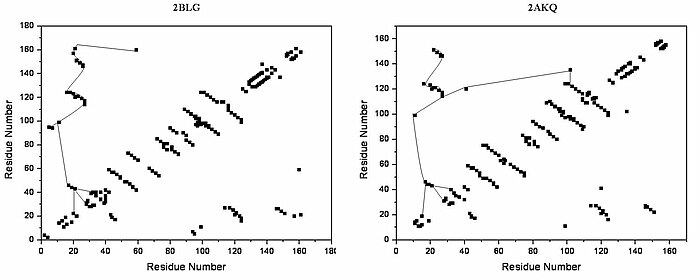
The crystal structures determined so far reveal that the typical lipocalin contains eight-stranded antiparallel-barrel arranged to form a conical central cavity in which the hydrophobic ligand is bound.
[citation needed] In the absence of alpha-helices, the main diagonal almost disappears and the cross-diagonals representing the beta-sheets dominate the plot.
In the three-dimensional structure, tertiary hydrogen bonds are formed (1) near to the entrance, directly involved in conformational rearrangement during ligand binding; and (2) at the bottom of the "barrel".
Difference in HB plots of open and ligand-bound form show few important individual changes in tertiary hydrogen bonding pattern.