Reference range
In: In medicine and health-related fields, a reference range or reference interval is the range or the interval of values that is deemed normal for a physiological measurement in healthy persons (for example, the amount of creatinine in the blood, or the partial pressure of oxygen).
It is a basis for comparison for a physician or other health professional to interpret a set of test results for a particular patient.
Sometimes the underlying cause is obvious; in other cases, challenging differential diagnosis is required to determine what is wrong and thus how to treat it.
Establishment methods for cutoffs include using an upper or a lower limit of a reference range.
When establishing reference ranges from bilateral organs (e.g., vision or hearing), both results from the same individual can be used, although intra-subject correlation must be taken into account.
A more accurate method is to perform the calculations on logarithmized values, as described in separate section later.
Taking the example from the previous section, the number of samples is 12 and the standard deviation is 0.42 mmol/L, resulting in: Thus, the lower limit of the reference range can be written as 4.4 (90% CI 4.1–4.7) mmol/L.
Likewise, with similar calculations, the upper limit of the reference range can be written as 6.3 (90% CI 6.0–6.6) mmol/L.
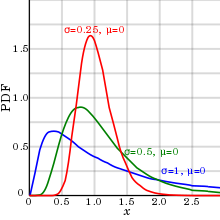
Also, only a log-normal distribution can compensate for the inability of almost all biological parameters to be of negative numbers (at least when measured on absolute scales), with the consequence that there is no definite limit to the size of outliers (extreme values) on the high side, but, on the other hand, they can never be less than zero, resulting in a positive skewness.
Reference ranges for substances that are usually within relatively narrow limits (coefficient of variation less than 0.213, as detailed below) such as electrolytes can be estimated by assuming normal distribution, whereas reference ranges for those that vary significantly (coefficient of variation generally over 0.213) such as most hormones[11] are more accurately established by log-normal distribution.
This is less than both 0.213 and 0.413, and thus both the lower and upper limit of fasting blood glucose can most likely be estimated by assuming normal distribution.
An alternative method of establishing a reference range with the assumption of log-normal distribution is to use the arithmetic mean and standard deviation.
This is somewhat more tedious to perform, but may be useful in cases where a study presents only the arithmetic mean and standard deviation, while leaving out the source data.
If the original assumption of normal distribution is less appropriate than the log-normal one, then, using the arithmetic mean and standard deviation may be the only available parameters to determine the reference range.
This bimodal pattern is commonly seen in tests that differ between men and women, such as prostate specific antigen.
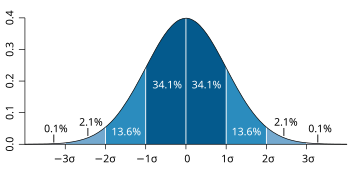
If the reference group used to establish the reference range can be assumed to be representative of the individual person in a healthy state, then a test result from that individual that turns out to be lower or higher than the reference range can be interpreted as that there is less than 2.5% probability that this would have occurred by random variability in the absence of disease or other condition, which, in turn, is strongly indicative for considering an underlying disease or condition as a cause.
Such further consideration can be performed, for example, by an epidemiology-based differential diagnostic procedure, where potential candidate conditions are listed that may explain the finding, followed by calculations of how probable they are to have occurred in the first place, in turn followed by a comparison with the probability that the result would have occurred by random variability.
The individual's value is higher than the upper limit of the reference range, and therefore has less than 2.5% probability of being a result of random variability, constituting a strong indication to make a differential diagnosis of possible causative conditions.
Hypercalcemia (usually defined as a calcium level above the reference range) is mostly caused by either primary hyperparathyroidism or malignancy,[13] and therefore, it is reasonable to include these in the differential diagnosis.
In contrast, for e.g. uric acid, having a level not exceeding the standard reference range still does not exclude the risk of getting gout or kidney stones.
Subsequently, optimal health ranges, when given by various sources, have an additional variability caused by various definitions of the parameter.
Ideally, there should rather be an estimation of what is the optimal value for every individual, when taking all significant factors of that individual into account - a task that may be hard to achieve by studies, but long clinical experience by a physician may make this method preferable to using reference ranges.
[15] For standard as well as optimal health ranges, and cut-offs, sources of inaccuracy and imprecision include: Also, reference ranges tend to give the impression of definite thresholds that clearly separate "good" or "bad" values, while in reality there are generally continuously increasing risks with increased distance from usual or optimal values.
With this and uncompensated factors in mind, the ideal interpretation method of a test result would rather consist of a comparison of what would be expected or optimal in the individual when taking all factors and conditions of that individual into account, rather than strictly classifying the values as "good" or "bad" by using reference ranges from other people.
In a recent paper, Rappoport et al.[16] described a novel way to redefine reference range from an electronic health record system.