Results of the 2016 United Kingdom European Union membership referendum
This referendum was conducted very differently from the European Communities membership referendum in 1975; a more localised and regionalised counting procedure was used, and the ballot was overseen by the Electoral Commission, a public body that did not exist at the time of the first vote.
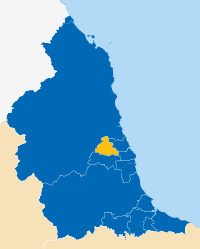
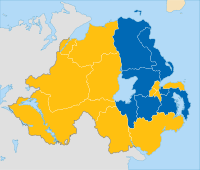
This article lists, by voting area for Great Britain and Gibraltar and by parliamentary constituency for Northern Ireland, all the results of the referendum, each ordered into national and regional sections.
The early results showed at different times narrow leads for both Remain and Leave; however, Leave took the lead in the national vote count for the final time at 02:58 BST when Castle Point declared its result.
The final result of the referendum for the United Kingdom and Gibraltar was declared at Manchester Town Hall at 0720 BST on Friday 24 June 2016, after all the 382 voting areas and the twelve UK regions had declared their results, by the Chief Counting Officer (CCO) for the referendum, Jenny Watson.
In a UK-wide referendum, the position of Chief Counting Officer (CCO) is held by the chair of the Electoral Commission.
For the purposes of this referendum and as had been the case with previous European Parliamentary elections, the overseas territory of Gibraltar was a single voting area placed in the South West England constituency.
While all council counting areas showed a majority to remain, one constituency, Banff and Buchan, voted to leave by an estimated ratio of 54% to 46%.
[10] The areas of Whalsay and South Unst in the Shetland Islands and An Taobh Siar and Nis in Na h-Eileanan an Iar (The Western Isles) also voted by a majority for Leave,[11] as did the town of Lossiemouth in Moray.
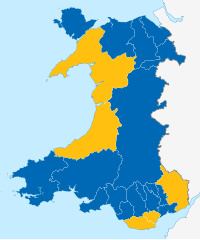
A total of 650,000 inhabitants born in England live in Wales (21%), with the areas with the highest percentages voting to leave.
Parts of rural Wales also saw a leave-vote majority (but also Anglesey where Welsh is just as commonly if not more usually spoken).
For the others Dr Chris Hanretty, a Reader in Politics at the University of East Anglia, estimated through a demographic model the 'Leave' and 'Remain' vote.
It shows the estimated (or actual) net decision in 648 of the 650 seats and the incumbents reflect those returned at the 2015 general election.
After the referendum, the annual British Social Attitudes survey questioned the public on their participation.
[18] Connected to this, the Information Commissioner's Office found that data had been unlawfully harvested from UK voters, and issued a notice of intent to fine Facebook £500,000.
[19] Also, the House of Commons Culture, Media and Sport Select Committee, released an interim report on "Disinformation and 'fake news'", stating that Russia had engaged in "unconventional warfare" through Twitter and other social media against the United Kingdom, designed to amplify support for a "leave" vote in Brexit.
[21] Kyle Taylor of the Fair Vote Project, a campaign group that called for a public inquiry and supported a second referendum, said: "The issue is too big to have half the country or more than half the country, wonder 'was that actually the result?
"[22] In July 2018 the Electoral Commission,[18] Information Commissioner's Office,[19] and the House of Commons Digital, Culture, Media and Sport Committee issued reports, finding variously criminal offences of overspending by Vote Leave, data offences, and foreign interference by Russia.