Solar irradiance
[4] The study and measurement of solar irradiance have several important applications, including the prediction of energy generation from solar power plants, the heating and cooling loads of buildings, climate modeling and weather forecasting, passive daytime radiative cooling applications, and space travel.
[citation needed] When one plots such spectral distributions as a graph, the integral of the function (area under the curve) will be the (non-spectral) irradiance.
e.g.: Say one had a solar cell on the surface of the earth facing straight up, and had DNI in units of Wm−2nm−1, graphed as a function of wavelength (in nm).
This represents the power per unit area of solar irradiance across the spherical surface surrounding the Sun with a radius equal to the distance to the Earth (1 AU).
This means that the approximately circular disc of the Earth, as viewed from the Sun, receives a roughly stable 1361 W/m2 at all times.
, meaning that the solar radiation arriving at the top of the atmosphere, averaged over the entire surface of the Earth, is simply divided by four to get 340 W/m2.
The solar flux density (insolation) onto a plane tangent to the sphere of the Earth, but above the bulk of the atmosphere (elevation 100 km or greater) is:
[24][25][26] However, current understanding based on various lines of evidence suggests that the lower values for the secular trend are more probable.
[26][27][28] Ultraviolet irradiance (EUV) varies by approximately 1.5 percent from solar maxima to minima, for 200 to 300 nm wavelengths.
This technique measures the electrical heating needed to maintain an absorptive blackened cavity in thermal equilibrium with the incident sunlight which passes through a precision aperture of calibrated area.
Accuracy uncertainties of < 0.01% are required to detect long term solar irradiance variations, because expected changes are in the range 0.05–0.15 W/m2 per century.
Pre-launch ground calibrations relied on component rather than system-level measurements since irradiance standards at the time lacked sufficient absolute accuracies.
Disagreement among overlapping observations indicates unresolved drifts that suggest the TSI record is not sufficiently stable to discern solar changes on decadal time scales.
[31] TRF encloses both the reference radiometer and the instrument under test in a common vacuum system that contains a stationary, spatially uniform illuminating beam.
The test instrument's precision aperture is positioned in the same location, without optically altering the beam, for direct comparison to the reference.
This agreement provides further evidence that TSI variations are primarily due to solar surface magnetic activity.
This difference between the new lower TIM value and earlier TSI measurements corresponds to a climate forcing of −0.8 W/m2, which is comparable to the energy imbalance.
[34] The Sun's rays are attenuated as they pass through the atmosphere, leaving maximum normal surface irradiance at approximately 1000 W/m2 at sea level on a clear day.
Humanmade or natural systems, however, can convert part of the absorbed radiation into another form such as electricity or chemical bonds, as in the case of photovoltaic cells or plants.
When the density of absorbers is layered, that is, depends much more on vertical than horizontal position in the atmosphere, to a good approximation the optical depth is inversely proportional to the projection effect, that is, to the cosine of the zenith angle.
Since transmittance decreases exponentially with increasing optical depth, as the sun approaches the horizon there comes a point when absorption dominates projection for the rest of the day.
With a relatively high level of absorbers this can be a considerable portion of the late afternoon, and likewise of the early morning.
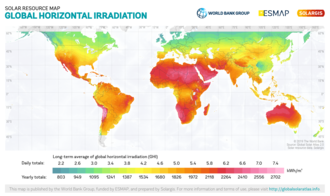
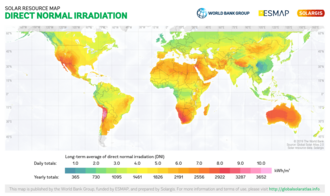
Assessment and mapping of solar potential at the global, regional and country levels have been the subject of significant academic and commercial interest.
One of the earliest attempts to carry out comprehensive mapping of solar potential for individual countries was the Solar & Wind Resource Assessment (SWERA) project,[37] funded by the United Nations Environment Program and carried out by the US National Renewable Energy Laboratory (NREL).
The National Aeronautics and Space Administration (NASA) provides data for global solar potential maps through the CERES experiment and the POWER project.
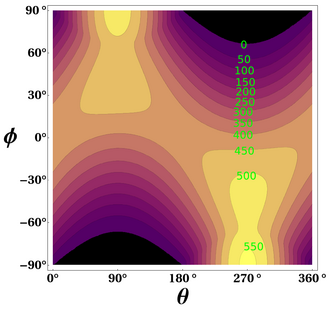
[40] This also means that the amount of sunlight falling on a solar panel at high latitude is not as low compared to one at the equator as would appear from just considering insolation on a horizontal surface.
[41] In fact, under clear skies a solar panel placed horizontally at the north or south pole at midsummer receives more sunlight over 24 hours (cosine of angle of incidence equal to sin(23.5°) or about 0.40) than a horizontal panel at the equator at the equinox (average cosine equal to 1/π or about 0.32).
[44] The projection effect can be used to design buildings that are cool in summer and warm in winter, by providing vertical windows on the equator-facing side of the building (the south face in the northern hemisphere, or the north face in the southern hemisphere): this maximizes insolation in the winter months when the Sun is low in the sky and minimizes it in the summer when the Sun is high.
A non-zero average global net radiation at the top of the atmosphere is indicative of Earth's thermal disequilibrium as imposed by climate forcing.
A few tenths of a percent change in the absolute TSI level is typically considered to be of minimal consequence for climate simulations.