Solar power
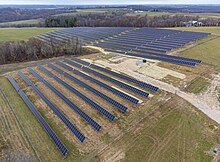
Three-quarters of new generation capacity is solar,[3] with both millions of rooftop installations and gigawatt-scale photovoltaic power stations continuing to be built.
[4][5] Along with onshore wind power, utility-scale solar is the source with the cheapest levelised cost of electricity for new installations in most countries.
[3] The International Energy Agency said in 2022 that more effort was needed for grid integration and the mitigation of policy, regulation and financing challenges.
Following the work of Russell Ohl in the 1940s, researchers Gerald Pearson, Calvin Fuller and Daryl Chapin created the silicon solar cell in 1954.
[32] A wide range of concentrating technologies exists: among the best known are the parabolic trough, the compact linear Fresnel reflector, the dish Stirling and the solar power tower.
[47][48] The early development of solar technologies starting in the 1860s was driven by an expectation that coal would soon become scarce, such as experiments by Augustin Mouchot.
[53] Charles Fritts installed the world's first rooftop photovoltaic solar array, using 1%-efficient selenium cells, on a New York City roof in 1884.
[54] However, development of solar technologies stagnated in the early 20th century in the face of the increasing availability, economy, and utility of coal and petroleum.
Other efforts included the formation of research facilities in the United States (SERI, now NREL), Japan (NEDO), and Germany (Fraunhofer ISE).
In the United States, President Jimmy Carter set a target of producing 20% of U.S. energy from solar by the year 2000, but his successor, Ronald Reagan, removed the funding for research into renewables.
In the mid-1990s development of both, residential and commercial rooftop solar as well as utility-scale photovoltaic power stations began to accelerate again due to supply issues with oil and natural gas, global warming concerns, and the improving economic position of PV relative to other energy technologies.
[58][63] In the early 2000s, the adoption of feed-in tariffs—a policy mechanism, that gives renewables priority on the grid and defines a fixed price for the generated electricity—led to a high level of investment security and to a soaring number of PV deployments in Europe.
For several years, worldwide growth of solar PV was driven by European deployment, but it then shifted to Asia, especially China and Japan, and to a growing number of countries and regions all over the world.
[72] According to a 2021 study, global electricity generation potential of rooftop solar panels is estimated at 27 PWh per year at costs ranging from $40 (Asia) to $240 per MWh (US, Europe).
The principal advantage of CSP is the ability to efficiently add thermal storage, allowing the dispatching of electricity over up to a 24-hour period.
Since peak electricity demand typically occurs at about 5 pm, many CSP power plants use 3 to 5 hours of thermal storage.
PV system output power also depends on ambient temperature, wind speed, solar spectrum, the local soiling conditions, and other factors.
Onshore wind power tends to be the cheapest source of electricity in Northern Eurasia, Canada, some parts of the United States, and Patagonia in Argentina whereas in other parts of the world mostly solar power (or less often a combination of wind, solar and other low carbon energy) is thought to be best.
[91] Thus solar is (or is predicted to become) the cheapest source of energy in all of Central America, Africa, the Middle East, India, South-east Asia, Australia, and several other regions.
Since reaching grid parity, some policies are implemented to promote national energy independence,[98] high tech job creation[99] and reduction of CO2 emissions.
[108][109] The overwhelming majority of electricity produced worldwide is used immediately because traditional generators can adapt to demand and storage is usually more expensive.
Common battery technologies used in today's home PV systems include nickel-cadmium, lead-acid, nickel metal hydride, and lithium-ion.
In addition, the Li-ion batteries of plug-in electric cars may serve as future storage devices in a vehicle-to-grid system.
Conventional hydroelectric dams work very well in conjunction with solar power; water can be held back or released from a reservoir as required.
Depending on local circumstances, beyond about 20–40% of total generation, grid-connected intermittent sources like solar tend to require investment in some combination of grid interconnections, energy storage or demand side management.
[132] Solar power carries an upfront cost to the environment via production with a carbon payback time of several years as of 2022[update],[132] but offers clean energy for the remainder of their 30-year lifetime.
[21] According to a 2021 study, obtaining 25% to 80% of electricity from solar farms in their own territory by 2050 would require the panels to cover land ranging from 0.5% to 2.8% of the European Union, 0.3% to 1.4% in India, and 1.2% to 5.2% in Japan and South Korea.
[142] However some countries, such as South Korea and Japan, use land for agriculture under PV,[143][144] or floating solar,[145] together with other low-carbon power sources.
The study cautions that supply needs to increase rapidly to match demand from large-scale deployment of solar and required grid upgrades.
[153][154][155] Although maintenance cost is already low compared to other energy sources,[156] some academics have called for solar power systems to be designed to be more repairable.