Subgiant
Rather than defining absolute features, a typical approach to determining a spectral luminosity class is to compare similar spectra against standard stars.
For example, the stars FK Com and 31 Com both lie in the Hertzsprung Gap and are likely evolutionary subgiants, but both are often assigned giant luminosity classes.
The initial stages of the subgiant branch in a star like the sun are prolonged with little external indication of the internal changes.
This causes stars to evolve slowly to higher luminosities as they age and broadens the main sequence band in the Hertzsprung–Russell diagram.
[7] Stars with 40 percent the mass of the Sun and larger have non-convective cores with a strong temperature gradient from the centre outwards.
[citation needed] The helium core mass is below the Schönberg–Chandrasekhar limit and it remains in thermal equilibrium with the fusing hydrogen shell.
Any increase in energy output from the shell goes into expanding the envelope of the star and the luminosity stays approximately constant.
They develop a more massive helium core, taking up a larger fraction of the star, before they exhaust the hydrogen in the entire convective region.
This continues for several million years before the core becomes hot enough to ignite hydrogen in a shell, which reverses the temperature and luminosity increase and the star starts to expand and cool.
The expansion stops and the radiated luminosity begins to increase, which is defined as the start of the red giant branch for these stars.
[9] Beyond about 8–12 M☉, depending on metallicity, stars have hot massive convective cores on the main sequence due to CNO cycle fusion.
This table shows the typical lifetimes on the main sequence (MS) and subgiant branch (SB), as well as any hook duration between core hydrogen exhaustion and the onset of shell burning, for stars with different initial masses, all at solar metallicity (Z = 0.02).
Also shown are the helium core mass, surface effective temperature, radius, and luminosity at the start and end of the subgiant branch for each star.
The difference in temperature is less pronounced at the end of the subgiant branch, but the low metallicity star is larger and nearly four times as luminous.
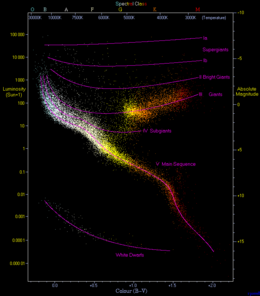
[8] A Hertzsprung–Russell (H–R) diagram is a scatter plot of stars with temperature or spectral type on the x-axis and absolute magnitude or luminosity on the y-axis.
Below approximately spectral type K3 the region between the main sequence and red giants is entirely empty, with no subgiants.
The subgiant branch is only visible if the cluster is sufficiently old that 1–8 M☉ stars have evolved away from the main sequence, which requires several billion years.
ω Centauri actually shows several separate subgiant branches for reasons that are still not fully understood, but appear to represent stellar populations of different ages within the cluster.
[14] At higher masses the stars would pulsate as Classical Cepheid variables while crossing the instability strip, but massive subgiant evolution is very rapid and it is difficult to detect examples.
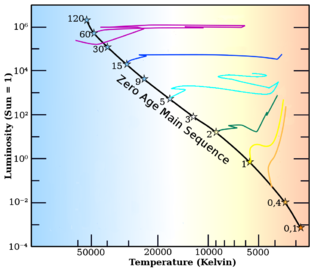
- the 5 M ☉ track shows a hook and a subgiant branch crossing the Hertzsprung gap
- the 2 M ☉ track shows a hook and pronounced subgiant branch
- lower-mass tracks show very short long-lasting subgiant branches