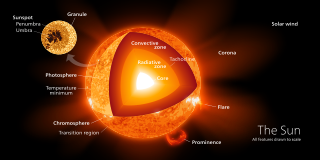
Sunspot
Most solar flares and coronal mass ejections originate in these magnetically active regions around visible sunspot groupings.
Similar phenomena indirectly observed on stars other than the Sun are commonly called starspots, and both light and dark spots have been measured.
[7] The earliest record of a deliberate sunspot observation also comes from China, and dates to 364 BC, based on comments by astronomer Gan De (甘德) in a star catalogue.
[9] The first clear mention of a sunspot in Western literature is circa 300 BC, by ancient Greek scholar Theophrastus, student of Plato and Aristotle and successor to the latter.
[14][15] After Johannes Fabricius' death at the age of 29, his reports remained obscure and were overshadowed by the independent discoveries of and publications about sunspots by Christoph Scheiner and Galileo Galilei.
One of these was the famous astronomer Johannes Hevelius who recorded 19 sunspot groups during the period of the early Maunder Minimum (1653-1679) in the book Machina Coelestis.
The president of the Royal Society commented that the upward trend in wheat prices was due to monetary inflation.
The umbra is the darkest region of a sunspot and is where the magnetic field is strongest and approximately vertical, or normal, to the Sun's surface, or photosphere.
[23] The penumbra is composed of radially elongated structures known as penumbral filaments and has a more inclined magnetic field than the umbra.
The temperature of the umbra is roughly 3000–4500 K, in contrast to the surrounding material at about 5780 K, leaving sunspots clearly visible as dark spots.
Isolated from the surrounding photosphere, a single sunspot would shine brighter than the full moon, with a crimson-orange color.
[25] In some forming and decaying sunspots, relatively narrow regions of bright material appear penetrating into or completely dividing an umbra.
These formations, referred to as light bridges, have been found to have a weaker, more tilted magnetic field compared to the umbra at the same height in the photosphere.
[4] Although the details of sunspot formation are still a matter of ongoing research, it is widely understood that they are the visible manifestations of magnetic flux tubes in the Sun's convective zone projecting through the photosphere within active regions.
In 2001, observations from the Solar and Heliospheric Observatory (SOHO) using sound waves traveling below the photosphere (local helioseismology) were used to develop a three-dimensional image of the internal structure below sunspots; these observations show that a powerful downdraft lies beneath each sunspot, forms a rotating vortex that sustains the concentrated magnetic field.
The Babcock Model explains that magnetic fields cause the behavior described by Spörer's law, as well as other effects, which are twisted by the Sun's rotation.
A telescope eyepiece can project the image, without filtration, onto a white screen where it can be viewed indirectly, and even traced, to follow sunspot evolution.
Due to their correlation with other kinds of solar activity, sunspots can be used to help predict space weather, the state of the ionosphere, and conditions relevant to short-wave radio propagation or satellite communications.
During peaks in sunspot activity, worldwide radio communication can be achieved on frequencies as high as the 6-meter VHF band.
[41][42] Analysis shows that it is possible that TSI was actually higher in the Maunder Minimum compared to present-day levels, but uncertainties are high, with best estimates in the range
[43] Sunspots, with their intense magnetic field concentrations, facilitate the complex transfer of energy and momentum to the upper solar atmosphere.
This transfer occurs through a variety of mechanisms, including generated waves in the lower solar atmosphere[44] and magnetic reconnection events.
[6] Since the mid-1990s, starspot observations have been made using increasingly powerful techniques yielding more and more detail: photometry showed starspot growth and decay and showed cyclic behavior similar to the Sun's; spectroscopy examined the structure of starspot regions by analyzing variations in spectral line splitting due to the Zeeman effect; Doppler imaging showed differential rotation of spots for several stars and distributions different from the Sun's; spectral line analysis measured the temperature range of spots and the stellar surfaces.
For example, in 1999, Strassmeier reported the largest cool starspot ever seen rotating the giant K0 star XX Trianguli (HD 12545) with a temperature of 3,500 K (3,230 °C), together with a warm spot of 4,800 K (4,530 °C).