Tide-predicting machine
A tide-predicting machine was a special-purpose mechanical analog computer of the late 19th and early 20th centuries, constructed and set up to predict the ebb and flow of sea tides and the irregular variations in their heights – which change in mixtures of rhythms, that never (in the aggregate) repeat themselves exactly.
[7] Several examples of tide-predicting machines remain on display as museum-pieces, occasionally put into operation for demonstration purposes, monuments to the mathematical and mechanical ingenuity of their creators.
Modern scientific study of tides dates back to Isaac Newton's Principia of 1687, in which he applied the theory of gravitation to make a first approximation of the effects of the Moon and Sun on the Earth's tidal waters.
[8] Beginning in 1776, Pierre-Simon Laplace made a fundamental advance on the equilibrium approximation, with the first description of oceanic tidal waters' dynamic responses to the tide-generating forces due to the Moon and Sun.
Darwin's harmonic developments of the tide-generating forces were later brought by A. T. Doodson up to date and extended in light of the new and more accurate lunar theory of E. W. Brown that remained current through most of the twentieth century.
The state to which the science of tide-prediction had arrived by the 1870s can be summarized: Astronomical theories of the Moon and Sun had identified the frequencies and strengths of different components of the tide-generating force.
In the age when calculations were done by hand and brain, with pencil and paper and tables, this was recognized as an immensely laborious and error-prone undertaking.
Thomson recognized that what was needed was a convenient and preferably automated way to evaluate repeatedly the sum of tidal terms such as: containing 10, 20 or even more trigonometrical terms, so that the computation could conveniently be repeated in full for each of a very large number of different chosen values of the date/time
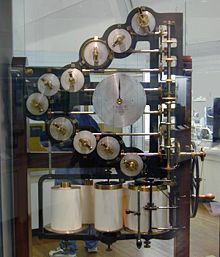
Thomson conceived his aim as to construct a mechanism that would evaluate this trigonometrical sum physically, e.g. as the vertical position of a pen that could then plot a curve on a moving band of paper.
In some designs, the movable end of the line was connected instead to a dial and scale from which tidal heights could be read off.
A flywheel of great inertia enabled the operator to turn the machine fast, without jerking the pulleys, and so to run off a year's curve in about twenty-five minutes.
Thomson acknowledged that the use of an over-and-under arrangement of the flexible line that summed the motion components was suggested to him in August 1872 by engineer Beauchamp Tower.
In these machines, the prediction was delivered in the form of a continuous graphical pen-plot of tidal height against time.
The plot was marked with hour- and noon-marks, and was made by the machine on a moving band of paper as the mechanism was turned.
A year's tidal predictions for a given place, usually a chosen seaport, could be plotted by the 1876 and 1879 machines in about four hours (but the drives had to be rewound during that time).
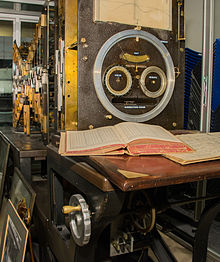
[15] Ferrel's machine delivered predictions by telling the times and heights of successive high and low waters, shown by pointer-readings on dials and scales.
Such numbers express the local tidal response to individual components of the global tide-generating potential, at different frequencies.
2 ("Old Brass Brains")[16] was designed in the 1890s by Rollin Harris, built in the United States Coast and Geodetic Survey, completed and brought into service in 1912, used for several decades including during the second World War, and retired in 1965.
An online demonstration is available to show the principle of operation of a 7-component version of a tide-predicting machine otherwise like Thomson's (Kelvin's) original design.
[27] The animation shows part of the operation of the machine: the motions of several pulleys can be seen, each moving up and down to simulate one of the tidal frequencies; and the animation also shows how these sinusoidal motions were generated by wheel rotations and how they were combined to form the resulting tidal curve.
These amplitudes and starting phase angles represented the local tidal constants, separately reset, and different for each place for which predictions were to be made.
Also, in the real Thomson machines, to save on motion and wear of the other parts, the shaft and pulley with the largest expected motion (for the M2 tide component at twice per lunar day) was mounted nearest to the pen, and the shaft and pulley representing the smallest component was at the other end, nearest to the point of fixing of the flexible cord or chain, to minimize unnecessary motion in the most part of the flexible cord.