[nb 1][6] The most impactful storm of the season was Hurricane Calvin, which made landfall near Manzanillo in the Mexican state of Colima as a Category 2 hurricane; it killed more than 30 people,[nb 2] mainly due to significant flooding, and damages amounted to $32 million (1993 USD).
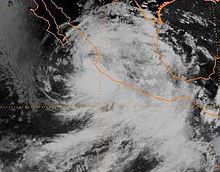
[10] Two months later, Hurricane Lidia came ashore at a similar intensity farther to the northwest along the coast of Sinaloa, where it caused considerable damage and multiple fatalities.
[nb 3][3] In conjunction with a cold front, Lidia's remnants generated severe weather in Texas, including a tornado that caused $8 million (1993 USD) in damage.
Figures for maximum sustained winds and position estimates are rounded to the nearest five units (knots, miles, or kilometers) and averaged over one minute, following National Hurricane Center practice.
This timeline documents the formation of tropical cyclones as well as the strengthening, weakening, landfalls, extratropical transitions, and dissipations during the season.
Satellite image of Hurricane Adrian on June 15
Satellite image of Tropical Storm Beatriz near landfall on June 19
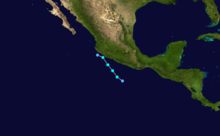
Storm path of Tropical Depression
Three-E
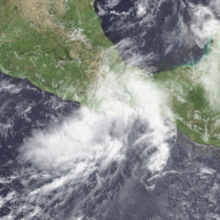
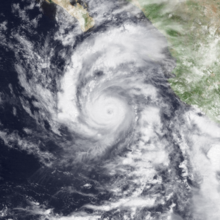
Satellite image of a strengthening Hurricane Calvin off the coast of Mexico on July 6
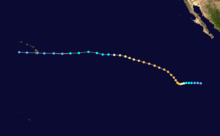
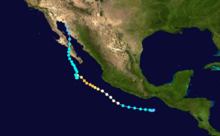
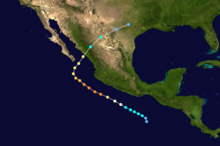
Storm path of Hurricane Calvin
Satellite image of Hurricane Dora at peak intensity on July 16
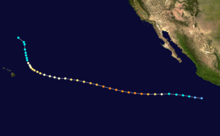
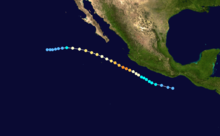
Storm path of Hurricane Dora
Satellite image of Hurricane Eugene near peak intensity on July 19
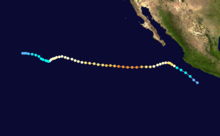
Storm path of Hurricane Eugene
Satellite image of Hurricane Fernanda at Category 4 status on August 12
Storm path of Hurricane Fernanda
Satellite image of a strengthening Hurricane Keoni on August 15
Storm path of Hurricane Greg
Satellite image of Hurricane Greg at peak intensity on August 19
Satellite image of Hurricane Hilary near peak intensity on August 21, with Tropical Storm Irwin visible to the lower right
Storm path of Tropical Storm Irwin
Storm path of Hurricane Hilary
Storm path of Hurricane Jova
Satellite image of Hurricane Jova shortly after peak intensity on September 1
Storm path of Hurricane Kenneth
Satellite image of Hurricanes Kenneth (
left
) and Lidia (
right
) both nearing peak intensity early on September 11
Storm path of Hurricane Lidia
Satellite image of Tropical Depression
Fourteen-E
late on September 21
Storm path of Tropical Storm Max
Satellite image of Tropical Storm Norma (
center
) shortly before absorbing Tropical Storm Max (
bottom
) late on October 3