Epidemiology of motor vehicle collisions
[5] Road toll figures in developed nations show that car collision fatalities have declined since 1980.
[6] Besides improving general road conditions like lighting and separated walkways, Japan has been installing intelligent transportation system technology such as stalled-car monitors to avoid crashes.
(thousands of km2) (millions) (thousands) of road network (kilometers) (millions of vehicles x km) inhabitants Representation of regional death statistics on map reveals significant differences even between neighboring regions.
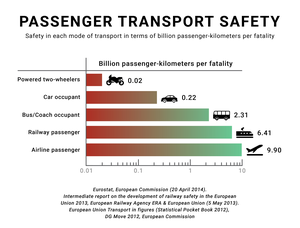
[16] Source IRTAD for the following data: The 28 EU-28 countries, for the 28 members, computed an indicator named "per 10 billion pkm".
[19] The safest of those 28 nations was Sweden (22 deaths/million inhabitants) while Romania reported the highest fatality rates of the EU in 2019.