Transportation safety in the United States
[3][4] For driving, the rate was 150 per 10 billion vehicle-miles: 750 times higher per mile than for flying in a commercial airplane.
[16][17] Except for a pause during the youth bulge of the 1960s (a time when many young, inexperienced drivers were on the road), progress in reducing fatal crashes has been steady.
Safety for other types of U.S. passenger transportation has also improved substantially, but long-term statistical data are not as readily available.
The FHA's Manual on Uniform Traffic Control Devices is mandatory for all roads "open for public travel", but states may have supplementary regulations.
Many state and local jurisdictions have adopted Vision Zero programs, with the goal of reducing transportation fatalities to zero.
[24] This differences might be linked to a lack of traffic calming, higher prevalence of wide, multilane stroads which encourage high speeds, reliance on stop signs instead of roundabouts, as well as a difference of approach in driving safety culture, for instance in the balance between liberty and mandatory or forbidden dangerous or unsafe behavior.
Comparing motorways (controlled-access, divided highways) in Europe and the United States, according to 2012 data, Denmark had the safest motorways with a rate of 0.72 road fatalities per 1 billion vehicle-km, while the United States had 3.38 road fatalities per 1 billion vehicle-km on its Interstate-type highways, often called freeways.
[40] Red light and speed limit enforcement cameras are used in about half of U.S. states, and overall the country has been slower to adopt the technology than many other wealthy nations.
Despite claims to the contrary, many studies have found the technology reduces crashes overall, especially dangerous "T-bone" right-angle crashes, but some have found that at the same time they can increase the number of rear-end collisions when inattentive or speeding drivers slam on the brakes to avoid a ticket.
[44] A red light program in St. Louis, Missouri was struck down by the state supreme court because it presumed the owner of the vehicle was driving.
[44] The 2021 Infrastructure Investment and Jobs Act reversed this ban and included $1.56 billion in funding that could be used for this or other transportation safety purposes.
[46] The Governors Highway Safety Association issued a report[47] with recommendations for addressing community concerns:[48] While strong regulation by the Federal Aviation Administration has dramatically reduced aviation accidents, federal regulation for road safety is weak, and many matters are left up to the states.
In South Carolina, North Dakota and Texas, more than 40% of road fatalities were attributed to driving under the influence (DUI).
[68] Speed limits, traffic density, topography, climate and many other factors affect the divergent accident rates by state.
In good driving conditions, many drivers in prima facie states presume (usually correctly) that police will allow some tolerance in enforcement.
Some found that fatality rates increased significantly on Interstate highways where speed limits were raised.
To many Republican voters, speed limits (and seat belt laws) are seen as intrusions on personal liberty.
[citation needed] According to transportation historian Owen Gutfreund, state governments may raise speed limits because raising the speed limit “sounds like such an easy regulatory win.” It's a simple way to “get government out of your face.”[71] On the other hand, according to the Insurance Institute for Highway Safety, Farmer performed a new study comparing deaths per billion miles traveled by state and roadway type — between 1993 and 2013 — on rural roads (the study does not cover the urban roads) concluded that each 5 mph (8 km/h) increase in the maximum speed limit is related to a 4 percent fatalities increase on some roads and an 8 percent increase on interstates and freeways.
[79] According to the IIHS rear crash safety of large trucks could be improved by 44% with forward collision warning systems and by 41% with automatic emergency braking.
[83] Crowded, traffic-choked Northeastern cities including Washington, D.C., Baltimore, Boston, Providence, Philadelphia, Newark, Hartford, New Haven, Springfield and Worcester, Massachusetts, were most likely to have car accidents.
In the event of an accident in a remote area, injured victims may not receive emergency medical care in time to save their lives.
According to the American Automobile Association (AAA), distraction plays a factor in 60% of moderate to serious teen car crashes.
According to Col. Tom Butler, chief of the Montana Highway Patrol, preliminary 2015 data indicated that 178 of the 224 vehicle occupant fatalities were of individuals not wearing seat belts.
Most data on the number of hours driven in a day and accident rates is for commercial drivers who are required to keep driving logs.
[89] With the increase in the volume of American cars, the number of deaths of drivers and passengers inside these rolling castles has decreased by 22%.
If Americans had stuck to smaller vehicles, 8,000 pedestrian lives would have been saved between 2000 and 2018, estimates Justin Tyndall, assistant professor of economics at the University of Hawaii.
The greatest risk in flying is in takeoff and landing, meaning that longer aircraft trips are safer per mile.
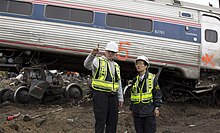
[101] Rail and bus (motorcoach) accidents also account for fatalities, although public transportation is far less dangerous than driving a personal vehicle.
During this period, around half of the states reduced the number of death by more than 20%, for instance: Alabama, Arizona, Arkansas, California, District of Columbia, Hawaii, Illinois, Iowa, Kansas, Louisiana, Maryland, Massachusetts, Mississippi, Nevada, New Jersey, New Mexico, New York, Oklahoma, Pennsylvania, Rhode Island, South Dakota, Tennessee, Vermont, Virginia, West Virginia, Wisconsin, Wyoming.
The results of these safety gaps is that more than 42,900 people were killed last year[114] The five NTSB’s Most Wanted List to prevent accidents, reduce injuries, and save lives are:[114]


Source: Federal Motor Carrier Safety Administration [ 107 ]