Warming stripes
[19] In less technical contexts, the graphics have been embraced by climate activists, used as cover images of books and magazines, used in fashion design, projected onto natural landmarks, and used on athletic team uniforms, music festival stages, and public infrastructure.
[9][25] Jason Samenow wrote in The Washington Post that the spiral graph was "the most compelling global warming visualization ever made",[26] before it was featured in the opening ceremony of the 2016 Summer Olympics.
[28] Independently, in November 2015, University of Georgia estuarine scientist Joan Sheldon made a "globally warm scarf" having 400 blue, red and purple rows, but could not contact Hawkins until 2022.
[9] Hawkins, a lead author for the IPCC 6th Assessment Report, received the Royal Society's 2018 Kavli Medal, in part "for actively communicating climate science and its various implications with broad audiences".
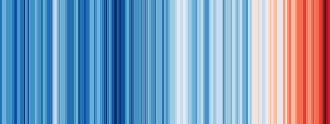
[32] As described in a BBC article, in the month the big meteorological agencies release their annual climate assessments, Hawkins experimented with different ways of rendering the global data and "chanced upon the coloured stripes idea".
[33] The National Centre for Atmospheric Science (UK), with which Hawkins is affiliated, states that the stripes "paint a picture of our changing climate in a compelling way.
[8] Colour field pioneer artist Barnett Newman said he was "creating images whose reality is self-evident", an ethos that Hawkins is said to have applied to the problem of climate change.
[49] Calling the graphic "imposter warming stripes", meteorologist Jeff Berardelli described it in January 2020 as "a mishmash of data riddled with gaps and inconsistencies" with an apparent objective to confuse the public.
[20] More specifically, warming stripes have been applied to knit-it-yourself scarves,[58] a vase,[59] neckties, cufflinks, bath towels,[60] vehicles, and a music festival stage,[35] as well as on the side of Freiburg, Germany, streetcars,[61] as municipal murals in Córdoba, Spain,[62] Anchorage, Alaska,[63] and Jersey,[64] on face masks during the COVID-19 pandemic,[65] in an action logo of the German soccer club 1.
[78] Remarking that "infiltrating popular culture is a means of triggering a change of attitude that will lead to mass action",[57] Hawkins surmised that making the graphics available for free has made them used more widely.
[83] In 2018, the German Weather Service's meteorological training journal Promet showed a warming stripes graphic on the cover of the issue titled "Climate Communication".
[88] The Science Information Service (Germany) noted in December 2019 that warming stripes were a "frequently used motif" in demonstrations by the School strike for the climate and Scientists for Future, and were also on the roof of the German Maritime Museum in Bremerhaven.
[22] On 18 January 2020, a 20-metre-wide artistic light-show installation of warming stripes was opened at the Gendarmenmarkt in Berlin, with the Berlin-Brandenburg Academy of Sciences building being illuminated in the same way.
[19] Some warned that warming stripes of individual countries or states, taken out of context, could advance the idea that global temperatures are not rising,[35] though research meteorologist J. Marshall Shepherd said that "geographic variations in the graphics offer an outstanding science communication opportunity".
[101] Others say the charts should include axes or legends,[35] though the website FAQ page explains the graphics were "specifically designed to be as simple as possible, and to start conversations... (to) fill a gap and enable communication with minimal scientific knowledge required to understand their meaning".
[35] In The Washington Post, Matthew Cappucci wrote that the "simple graphics ... leave a striking visual impression" and are "an easily accessible way to convey an alarming trend", adding that "warming tendencies are plain as day".
[83] CBS News contributor Jeff Berardelli noted that the graphics "aren't based on future projections or model assumptions" in the context of stating that "science is not left or right.