Wind power in the United States
[17] From 1974 to the mid-1980s, the United States government worked with industry to advance the technology and enable large commercial wind turbines.
This research and development program pioneered many of the multi-megawatt turbine technologies in use today, including: steel tube towers, variable-speed generators, composite blade materials, partial-span pitch control, as well as aerodynamic, structural, and acoustic engineering design capabilities.
Subsidizing this with production tax credits makes wind power cheaper for utilities and consumers, but at the expense of taxpayers.
In 2010, however, newly installed generating capacity was about half of the previous year due to various factors, including the financial crisis, and recession.
This opened up new opportunities and in Indiana, Michigan, and Ohio, the price of power from wind turbines 300 to 400 feet (90 to 120 m) above the ground competed with conventional fossil fuels like coal.
Prices had fallen to about 4 cents per kilowatt-hour in some cases and utilities had been increasing the amount of wind energy in their portfolio, saying it is their cheapest option.
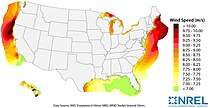
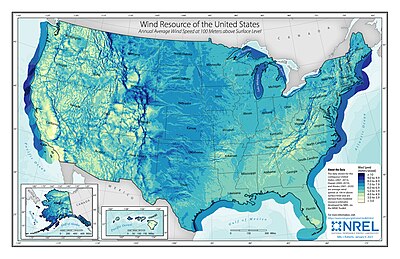
[44] According to the National Renewable Energy Laboratory, the contiguous United States has the potential for 10,459 GW of onshore wind power.
[56] In order to achieve this, significant advances in cost, performance and reliability are needed, based on a 2011 report from a coalition of researchers from universities, industry, and government, supported by the Atkinson Center for a Sustainable Future.
Transmission companies will recoup the cost of constructing the new power lines, expected to be completed in 2013, from fees estimated at $4 per month for residential customers.
Programs leading to careers in the wind power industry are provided at tech schools, community colleges and universities in Oklahoma.
[89] As of April 2009, over 100 companies are producing components for wind turbines, employing thousands of workers in the manufacture of parts as varied as towers, composite blades, bearings and gears.
Their manufacturing facilities are spread across 40 states, employing workers from the Southeast to the Steel Belt, to the Great Plains and on to the Pacific Northwest.
[97] Recent U.S. policy has generally been to provide an inflation-adjusted federal production tax credit (PTC) of $15 per MW·h (in 1995 dollars) generated for the first ten years of operation for wind energy sold.
In 2007, farmers, with no investment on their part, typically received $3,000–5,000 per year in royalties[104] from the local utility for siting a single, large, advanced-design wind turbine.
[111] Communities which support renewable energy projects may oppose local development due to perceived environmental harms.
[114] Coastal residents have opposed offshore wind farms because of fears about impacts on marine life, the environment, electric power rates, aesthetics, and recreation such as fishing and boating.
However, residents also cite improved electric power rates, air quality, and job creation as positive impacts they would expect from wind farms.
[115][116] Because the bases of offshore turbines function as artificial reefs, studies have shown that after the initial disturbance of construction, local fish and shellfish are positively affected.
[115] Five exploratory leases for wind power production on the Outer Continental Shelf offshore from New Jersey and Delaware were issued in June 2009 by the Secretary of the Interior.
The leases authorize data gathering activities, allowing for the construction of meteorological towers on the Outer Continental Shelf from six to 18 miles (29 km) offshore.
[122][123][124] In 2009, Deepwater signed an agreement with National Grid to sell the power from a smaller $200-million, 30-MW wind farm off Block Island, at an initial price of 24.4 ¢/kW·h.
If built it will be the largest in the U.S.[136] In September 2020, New Jersey officials halted the Ørsted Ocean Wind Project citing concerns about misrepresented economic benefits of offshore wind, including construction of monopoles, utilization of women- and minority-owned businesses, union labor, possible negative effects on the fishing industry.
Challenges include not being able to navigate a wind turbine installation vessel to the Great Lakes Waterway through the St. Lawrence Seaway, Welland Canal, or Soo Locks.
[140] A planned pilot project of 6 fixed bottom wind turbines on Lake Erie, Icebreaker, was put on hold in December 2023.
Large scale distribution of wind farms significantly reduce short term variability, limiting the relative standard deviation of the capacity factor to about 45%.
[144] The United States Fish and Wildlife Service has published voluntary guidelines for design and siting of wind turbines to minimize bird and bat deaths.
The government also ordered federal law enforcement field agents not to pursue bird-death prosecutions against wind companies without prior approval from Washington.
Duke Energy plead guilty, and was fined $1 million, for the deaths of 160 birds, including 14 golden eagles, at two wind farms in Wyoming.
[150][151] More than 30,000 wind turbine locations are within federally protected bird habitats, out of which almost 24,000 lie in the migratory corridor of the whooping crane and almost 3000 in the breeding grounds of the endangered greater sage-grouse.
[155] In 2005, with the passing of the Energy Policy Act, the Minerals Management Service within the Department of the Interior had authority over wind turbine development on federal waters, like the Outer Continental Shelf, and was responsible for evaluating economic value, potential environmental impacts, and coordinating with federal and state agencies when approving wind power permits.


Pioneer Prairie