Demographics of Croatia
According to final results published on 22 September 2022 the permanent population of Croatia at the 2021 census (31st Aug) had reached 3.87 million.
The demographic history of Croatia is marked by significant migrations, including the arrival of the Croats in the area growth of Hungarian and German-speaking population since the union of Croatia and Hungary, and joining of the Habsburg Empire, migrations set off by Ottoman conquests and growth of Italian speaking population in Istria and in Dalmatia during Venetian rule there.
Recently, significant migrations came as a result of the Croatian War of Independence when hundreds of thousands were displaced, while the 2010s brought a new wave of emigration which strengthened after Croatia's accession to the EU in 2013.
[5] The Croatian Bureau of Statistics forecast that the population may even shrink to 3.1 million by 2051, depending on the actual birth rate and the level of net migration.
Out of the total number, 32,677 children were born in wedlock or within 300 days after the end of the marriage, and the average age of mothers at the birth of their first child was 28.4 years.
[22] Croatian citizenship is acquired in a multitude of ways, based on origin, place of birth, naturalization and international treaties.
Those are Serbs, Czechs, Slovaks, Italians, Istro-Romanians ("Vlachs"), Hungarians, Jews, Germans, Austrians, Ukrainians, Romanians, Ruthenians, Macedonians, Bosniaks, Slovenes, Montenegrins, Russians, Bulgarians, Poles, Roma, Turks and Albanians.
[39] 2 including Austrians 247 0.01%, Bulgarians 331 0.01%, Germans 2,902 0.07%, Jews 576 0.01%, Poles 567 0.01%, Romanians 475 0.01%, Russians 906 0.02%, Ruthenians 2,337 0.05, Slovaks 4,712 0.11% Turks 300 0.01%, Ukrainians 1,977 0.04%, Koreans 211 0.01%, Istro-Romanians 12 0.00% 3 including Austrians 297 0.01%, Bulgarians 350 0.01%, Germans 2,965 0.07%, Jews 509 0.01%, Poles 672 0.02%, Romanians 435 0.01%, Russians 1,279 0.03%, Ruthenians 1,936 0.05, Slovaks 4,753 0.11% Turks 367 0.01%, Ukrainians 1,878 0.04%, Vlachs 29 0.00% The demographic history of Croatia is characterised by significant migrations, starting with the arrival of the Croats in the area.
According to the work De Administrando Imperio written by the 10th-century Byzantine Emperor Constantine VII, the Croats arrived in the area of modern-day Croatia in the early 7th century.
[45][46] The Ottoman conquests initiated a westward migration of parts of the Croatian population;[47] the Burgenland Croats are direct descendants of some of those settlers.
[49] Similarly, Venetian Republic rule in Istria and in Dalmatia, following the Fifth and the Seventh Ottoman–Venetian Wars ushered gradual growth of Italian speaking population in those areas.
[50] Following the collapse of Austria-Hungary in 1918, the Hungarian population declined, especially in the areas north of the Drava river, where they represented the majority before World War I.
[51] The period between 1890 and World War I was marked by large economic emigration from Croatia to the United States, and particularly to the areas of Pittsburgh, Pennsylvania, Cleveland, Ohio, and Chicago, Illinois.
[56] However, after the Third Italian War of Independence (1866), when the Veneto and Friuli regions were ceded by the Austrians to the newly formed Kingdom Italy, Istria and Dalmatia remained part of the Austro-Hungarian Empire, together with other Italian-speaking areas on the eastern Adriatic.
[57] During the meeting of the Council of Ministers of 12 November 1866, Emperor Franz Joseph I of Austria outlined a wide-ranging project aimed at the Germanization or Slavization of the areas of the empire with an Italian presence:[58] His Majesty expressed the precise order that action be taken decisively against the influence of the Italian elements still present in some regions of the Crown and, appropriately occupying the posts of public, judicial, masters employees as well as with the influence of the press, work in South Tyrol, Dalmatia and Littoral for the Germanization and Slavization of these territories according to the circumstances, with energy and without any regard.
[64] Bartoli's evaluation was followed by other claims that Auguste de Marmont, the French Governor General of the Napoleonic Illyrian Provinces commissioned a census in 1809 which found that Dalmatian Italians comprised 29% of the total population of Dalmatia.
[69] In Rijeka the Italians were the relative majority in the municipality (48.61% in 1910), and in addition to the large Croatian community (25.95% in the same year), there was also a fair Hungarian minority (13.03%).
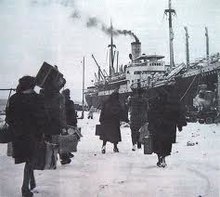
The emigrants, who had lived in the now Yugoslav territories of the Julian March (Karst Region and Istria), Kvarner and Dalmatia, largely went to Italy, but some joined the Italian diaspora in the Americas, Australia and South Africa.
In particular, according to the official Croatian census of 2011, there are 83 Dalmatian Italians in Split (equal to 0.05% of the total population), 16 in Šibenik (0.03%) and 27 in Dubrovnik (0.06%).
The 1940s and the 1950s in Yugoslavia were marked by colonisation of settlements where the displaced Germans used to live by people from the mountainous parts of Bosnia and Herzegovina, Serbia and Montenegro, and migrations to larger cities spurred on by the development of industry.
[18][19] Significant migrations have been happening after the accession of Croatia to the European Union, with a persistent growth since 2013, and the population leaving is largely younger and more educated.
[86] The 1918 flu pandemic started to take its toll in Croatia in July 1918, with peaks of the disease occurring in October and November.
[87] Around 295,000 people were killed on the territory of present-day Croatia during World War II, according to the demographer Bogoljub Kočović.
[88] The demise of the armed forces of the Independent State of Croatia and of the civilians accompanying the troops at the end of World War II was followed by the Yugoslav death march of Nazi collaborators.
[97][98] Besides these, the following languages are also recognised: Albanian, Bosnian, Bulgarian, German, Hebrew, Macedonian, Montenegrin, Polish, Romanian, Romani, Russian, Rusyn, Slovenian, Turkish and Ukrainian.
[100] The Croatian lect is generally viewed as one of the four standard varieties of the Shtokavian dialect of Serbo-Croatian, a South Slavic language.
Croatian is written using the Latin alphabet and there are three major dialects spoken on the territory of Croatia, with the Shtokavian idiom used as the literary standard.
[114] A worldwide study about the quality of living in different countries published by Newsweek in August 2010 ranked the Croatian education system at 22nd, a position shared with Austria.
[7] There are 205 companies, government or education system institutions and non-profit organizations in Croatia pursuing scientific research and the development of technology.
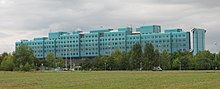
[121] Croatia has a universal health care system, the roots of which can be traced back to the Hungarian-Croatian Parliament Act of 1891, providing a form of mandatory insurance for all factory workers and craftsmen.