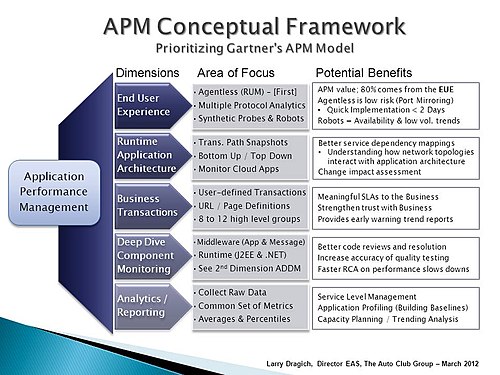
Application performance management
APM strives to detect and diagnose complex application performance problems to maintain an expected level of service.
As a result, the term APM has become diluted and has evolved into a concept for managing application performance across many diverse computing platforms, rather than a single market.
Measuring the transit of traffic from user request to data and back again is part of capturing the end-user experience (EUE).
Active monitoring, on the other hand, consists of synthetic probes and web robots predefined to report system availability and business transactions.
UEM, as practiced today, goes beyond availability to capture latencies and inconsistencies as human beings interact with applications and other services.
This helps lay the foundation for event correlation and provides the basis for a general understanding of how network topologies interact with application architectures.
This allows for meaningful SLA reports, and provides trending information on application performance from a business perspective: start with broad categories and refine them over time.
Deep dive component monitoring (DDCM) requires an agent installation and is generally targeted at middleware, focusing on web, application, and messaging servers.
A robust monitor shows a clear path from code execution (e.g., spring and struts) to the URL rendered, and finally to the user request.
Since DDCM is closely related to the second dimension in the APM model, most products in this field also provide application discovery dependency mapping (ADDM) as part of their offering.
Collecting raw data from the other tool sets across the APM model provides flexibility in application reporting.