Climate of the Arctic
In winter, this relatively warm water, even though covered by the polar ice pack, keeps the North Pole from being the coldest place in the Northern Hemisphere, and it is also part of the reason that Antarctica is so much colder than the Arctic.
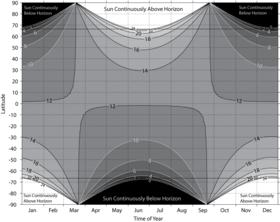
The most widely used definition, the area north of the Arctic Circle, where the sun does not set on the June Solstice, is used in astronomical and some geographical contexts.
Due to the lack of major population centres in the Arctic, weather and climate observations from the region tend to be widely spaced and of short duration compared to the midlatitudes and tropics.
National and commercial expeditions continued to expand the detail on maps of the Arctic through the eighteenth century, but largely neglected other scientific observations.
By the early 19th century some expeditions were making a point of collecting more detailed meteorological, oceanographic, and geomagnetic observations, but they remained sporadic.
Likewise the United States and Canadian governments cut back on spending for Arctic observing as the perceived need for the DEWLINE declined.
[2] The extensive array of satellite-based remote-sensing instruments now in orbit has helped to replace some of the observations that were lost after the Cold War, and has provided coverage that was impossible without them.
During these two years thousands of scientists from over 60 nations will co-operate to carry out over 200 projects to learn about physical, biological, and social aspects of the Arctic and Antarctic (IPY).
These pieces of software are sometimes relatively simple, but often become highly complex as scientists try to include more and more elements of the environment to make the results more realistic.
Another interesting use of models has been to use them, along with historical data, to produce a best estimate of the weather conditions over the entire globe during the last 50 years, filling in regions where no observations were made (ECMWF).
The continued low temperatures, and the persisting white snow cover, mean that this additional energy reaching the Arctic from the sun is slow to have a significant impact because it is mostly reflected away without warming the surface.
As the Arctic continues receiving energy from the sun during this time, the land, which is mostly free of snow by now, can warm up on clear days when the wind is not coming from the cold ocean.
Unusual clear periods can lead to increased sea-ice melt or higher temperatures (NSIDC Archived December 23, 2007, at the Wayback Machine).
However, the high elevation, and corresponding lower temperatures, help keep the bright snow from melting, limiting the warming effect of all this solar radiation.
The sea ice begins to refreeze, and eventually gets a fresh snow cover, causing it to reflect even more of the dwindling amount of sunlight reaching it.
By November, winter is in full swing in most of the Arctic, and the small amount of solar radiation still reaching the region does not play a significant role in its climate.
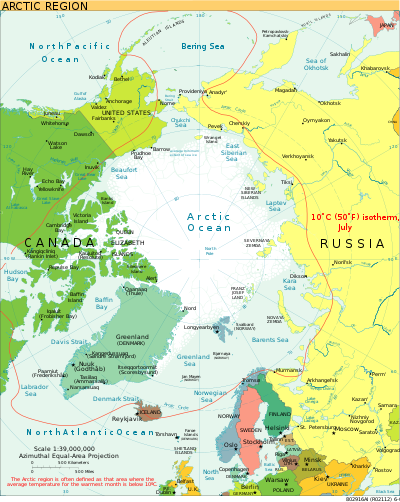
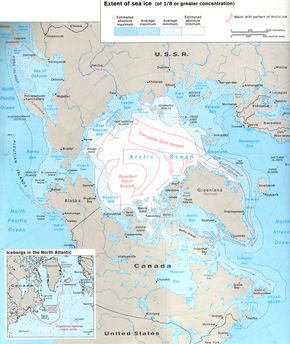
An earlier climatology of temperatures in the Arctic, based entirely on available data, is shown in this map from the CIA Polar Regions Atlas.
[3] The World Meteorological Organization has recognized in 2020 a temperature of −69.6 °C (−93.3 °F) measured near the topographic summit of the Greenland Ice Sheet on 22 December 1991, as the lowest in the Northern Hemisphere.
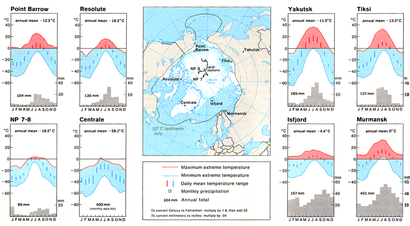
The small daily temperature range (the length of the vertical bars) results from the fact that the sun's elevation above the horizon does not change much or at all in this region during one day.
Coastal areas can be affected by nearby open water, or by heat transfer through sea ice from the ocean, and many parts lose their snow cover in summer, allowing them to absorb more solar radiation and warm more than the interior.
The coastal regions in the southern part of the island are influenced more by open ocean water and by frequent passage of cyclones, both of which help to keep the temperature there from being as low as in the north.
During the 46-year period when weather records were kept on Shemya Island, in the southern Bering Sea, the average temperature of the coldest month (February) was −0.6 °C (30.9 °F) and that of the warmest month (August) was 9.7 °C (49.5 °F); temperatures never dropped below −17 °C (1 °F) or rose above 18 °C (64 °F); Western Regional Climate Center) The rest of the seas have ice cover for some part of the winter and spring, but lose that ice during the summer.
In the station-climatology figure above, the plots for Point Barrow, Tiksi, Murmansk, and Isfjord are typical of land areas adjacent to seas that are ice-covered seasonally.
All variables are measured at relatively few stations in the Arctic, but precipitation observations are made more uncertain due to the difficulty in catching in a gauge all of the snow that falls.
The warm air transported into these regions also mean that liquid precipitation is more common than over the rest of the Arctic Basin in both winter and summer.
[6][7] The Labrador, Norwegian, Greenland, and Barents Seas and Denmark and Davis Straits are strongly influenced by the cyclones in the North Atlantic storm track, which is most active in winter.
The Bering Sea is influenced by the North Pacific storm track, and has annual precipitation totals between 400 and 800 mm (16 and 31 in), also with a winter maximum.
[14] In 2009, NASA reported that 45 percent or more of the observed warming in the Arctic since 1976 was likely a result of changes in tiny airborne particles called aerosols.
[14] A study published in the journal Science in September 2009 determined that temperatures in the Arctic are higher presently than they have been at any time in the previous 2,000 years.
[16] Samples from ice cores, tree rings and lake sediments from 23 sites were used by the team, led by Darrell Kaufman of Northern Arizona University, to provide snapshots of the changing climate.