Measurement of sea ice
[1] The arctic sea ice is a dynamic climate-system component and is linked to the Atlantic multidecadal variability and the historical climate over various decades.
Russia's Arctic and Antarctic Research Institute has compiled ice charts dating back to 1933.
One is records kept by Antarctic whalers that document the location of all whales caught and relate to sea ice observations directly.
Other proxies use the presence of phytoplankton-derived organic compounds and other extremophiles traces[4] in Antarctic ice cores and sediments.
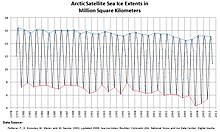
[1] Useful satellite data concerning sea ice began in December 1972 with the Electrically Scanning Microwave Radiometer (ESMR) instrument.
However, this was not directly comparable with the later SMMR/SSMI, and so the practical record begins in late 1978 with the launch of NASA's Scanning Multichannel Microwave Radiometer (SMMR) satellite.,[5] and continues with the Special Sensor Microwave/Imager (SSMI).
[6] However, the record relies on stitching together measurements from a series of different satellite-borne instruments, which can lead to errors associated with intercalibration across the sensor changes.
[7] Satellite images of sea ice are made from observations of microwave energy radiated from the Earth's surface.
[9] The technique has a limited vertical resolution and is easily confused by the presence of even small amounts of open water.
Recent advancements led to the development of new experimental sea-ice thickness products from satellite radar altimetry during the Arctic melt season.
[10] Starting in 1958 U. S. Navy submarines collected upward-looking sonar profiles, for navigation and defense, and converted the information into estimates of ice thickness.
[16] Temperature buoys allow to estimate conductive, latent and ocean heat fluxes for undeformed ice[17] and for pressure ridges.
Upward looking or multibeam sonars can be also mounted on remotely operated underwater vehicles (ROV) to investigate sea ice draft over the diameter of several hundreds of meters and several months.
It is also useful to provide a description of the ice edge in terms of indications of freezing or thawing, wind-driven advance or retreat, and compactness or diffuseness.
The European Space Agency's Cryosat-2 satellite was launched in April 2010 on a quest to map the thickness and shape of the Earth's polar ice cover.
Sea ice rejects salt over time and becomes less salty resulting in a higher melting point.
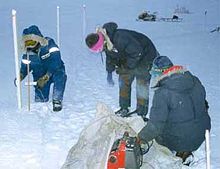
In spite of the importance of mass balance measurements and the relatively simple equipment involved in making them, there are few observational results.
This is due, in large part, to the expense involved in operating a long-term field camp to serve as the base for these studies.
[32] Cryosat-2, launched in April 2010, has the ability to measure the freeboard of ice flows, just like ICESat, only that it uses radar instead of laser pulses.
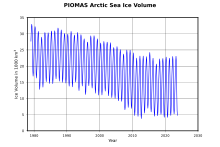
According to scientific measurements, both the thickness and extent of summer sea ice in the Arctic have shown a dramatic decline over the past thirty years.
William K. de la Mare, 1997, in Abrupt mid-twentieth-century decline in Antarctic sea-ice extent from whaling records[3] found a southwards shift in ice edge based on whaling records; these findings have been questioned, but later papers by de la Mare and by Cotte support the same conclusion.
[35] Scientists use the 1981 to 2010 average because it provides a consistent baseline for year-to-year comparisons of sea ice extent.