Astronomical spectroscopy
A stellar spectrum can reveal many properties of stars, such as their chemical composition, temperature, density, mass, distance and luminosity.
Spectroscopy is also used to study the physical properties of many other types of celestial objects such as planets, nebulae, galaxies, and active galactic nuclei.
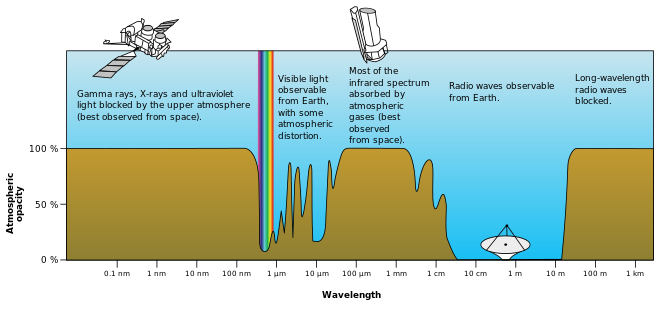
Astronomical spectroscopy is used to measure three major bands of radiation in the electromagnetic spectrum: visible light, radio waves, and X-rays.
While all spectroscopy looks at specific bands of the spectrum, different methods are required to acquire the signal depending on the frequency.
Ozone (O3) and molecular oxygen (O2) absorb light with wavelengths under 300 nm, meaning that X-ray and ultraviolet spectroscopy require the use of a satellite telescope or rocket mounted detectors.
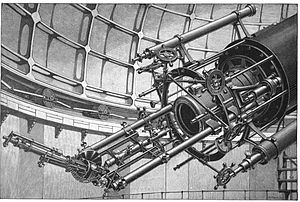
[2] Physicists have been looking at the solar spectrum since Isaac Newton first used a simple prism to observe the refractive properties of light.
[3] In the early 1800s Joseph von Fraunhofer used his skills as a glassmaker to create very pure prisms, which allowed him to observe 574 dark lines in a seemingly continuous spectrum.
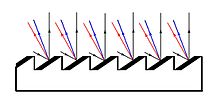
[7] By creating a "blazed" grating which utilizes a large number of parallel mirrors, the small portion of light can be focused and visualized.
These new spectroscopes were more detailed than a prism, required less light, and could be focused on a specific region of the spectrum by tilting the grating.
[6] The limitation to a blazed grating is the width of the mirrors, which can only be ground a finite amount before focus is lost; the maximum is around 1000 lines/mm.
Volume phase holographic gratings use a thin film of dichromated gelatin on a glass surface, which is subsequently exposed to a wave pattern created by an interferometer.
Because they are sealed between two sheets of glass, the holographic gratings are very versatile, potentially lasting decades before needing replacement.
Historically, photographic plates were widely used to record spectra until electronic detectors were developed, and today optical spectrographs most often employ charge-coupled devices (CCDs).
The flux scale of a spectrum can be calibrated as a function of wavelength by comparison with an observation of a standard star with corrections for atmospheric absorption of light; this is known as spectrophotometry.
Radio interferometry was pioneered in 1946, when Joseph Lade Pawsey, Ruby Payne-Scott and Lindsay McCready used a single antenna atop a sea cliff to observe 200 MHz solar radiation.
[14] The aperture synthesis process, which involves autocorrelating and discrete Fourier transforming the incoming signal, recovers both the spatial and frequency variation in flux.
[5]: 42–44 [17] By comparing the absorption lines of the Sun with emission spectra of known gases, the chemical composition of stars can be determined.
[1]: 69 By analyzing the equivalent width of each spectral line in an emission spectrum, both the elements present in a star and their relative abundances can be determined.
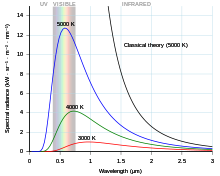
[19][20] In 1860 Gustav Kirchhoff proposed the idea of a black body, a material that emits electromagnetic radiation at all wavelengths.
[27] Since his discovery, astronomers have determined that a large portion of galaxies (and most of the universe) is made up of dark matter.
[31] Quasars are now thought to be galaxies formed in the early years of our universe, with their extreme energy output powered by super-massive black holes.
Absorption (or dark) nebulae are made of dust and gas in such quantities that they obscure the starlight behind them, making photometry difficult.
In 1864 William Huggins noticed that many nebulae showed only emission lines rather than a full spectrum like stars.
From the work of Kirchhoff, he concluded that nebulae must contain "enormous masses of luminous gas or vapour.
[39] Dust and molecules in the interstellar medium not only obscures photometry, but also causes absorption lines in spectroscopy.
Their spectral features are generated by transitions of component electrons between different energy levels, or by rotational or vibrational spectra.
[40] The chemical reactions that form these molecules can happen in cold, diffuse clouds[41] or in dense regions illuminated with ultraviolet light.
For cooler objects, including Solar System planets and asteroids, most of the emission is at infrared wavelengths we cannot see, but that are routinely measured with spectrometers.
In what is now known as the Tholen classification, the C-types are made of carbonaceous material, S-types consist mainly of silicates, and X-types are 'metallic'.
For example, the chemical composition of Comet ISON[59] was determined by spectroscopy due to the prominent emission lines of cyanogen (CN), as well as two- and three-carbon atoms (C2 and C3).