Circular dichroism
[2] Vibrational circular dichroism, which uses light from the infrared energy region, is used for structural studies of small organic molecules, and most recently proteins and DNA.
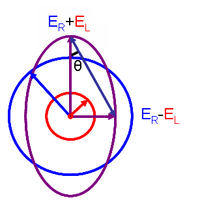
In a CD experiment, equal amounts of left and right circularly polarized light of a selected wavelength are alternately radiated into a (chiral) sample.
In ordered structures lacking two-fold rotational symmetry, optical activity,[8][9] including differential transmission[10] (and reflection[11]) of circularly polarized waves also depends on the propagation direction through the material.
Circular Dichroism (CD) spectroscopy is a powerful tool in biophysical and biochemical research, providing unique insights into the structural and stability characteristics of biomolecules.
Because CD arises from the differential absorption of left- and right-circularly polarized light by optically active molecules, it is inherently sensitive to the chiral nature of biological macromolecules.
This makes it particularly valuable for analyzing secondary structures, as seen in the characteristic CD spectral signatures of the α-helices and β-sheets of proteins and the double helices of nucleic acids.
Its ability to provide complementary data makes it an essential component of the modern biophysical toolbox, with applications spanning virtually every field of biomolecular research.
Moreover, CD spectroscopy has been used in bioinorganic interface studies; specifically, it has been used to analyze the differences in secondary structure of an engineered protein before and after titration with a reagent.
The signals obtained in this region are due to the absorption, dipole orientation, and nature of the surrounding environment of the phenylalanine, tyrosine, cysteine (or S-S disulfide bridges) and tryptophan amino acids.
Rather, the near-UV range can be considered a fingerprint region because its spectral profile is exquisitely dependent on the composition of aromatic residues and the conformation and environment of their side chains.
Visible CD spectra (spanning approximately 350 nm to 700 nm) provide structural information on the nature of the prosthetic groups in proteins, e.g., the heme groups in hemoglobin and cytochrome c. Visible CD spectroscopy is a very powerful technique to study metal–protein interactions and can resolve individual d–d electronic transitions as separate bands.
Different DNA conformations—A-DNA, B-DNA, and Z-DNA—exhibit distinct CD spectral signatures due to variations in base stacking and helical geometry.
[19][20] Similarly, RNA structures, including stem-loops, pseudoknots, and G-quadruplexes, produce unique CD spectra that reflect their specific folding patterns and base interactions.
G-quadruplexes, in particular, show characteristic positive and negative bands in the CD spectrum depending on their topology (parallel, antiparallel, or hybrid).
[21] These spectral features make UV-CD an essential technique for studying nucleic acid folding, stability, and interactions with ligands.
For instance, CD spectroscopy has been conducted on solid state semiconducting materials such as TiO2 to obtain large signals in the UV wavelength range, where the electronic transitions for biomolecules often occur.
Examples include assessing batch-to-batch consistency in biotherapeutics, evaluating the effects of mutations, and studying the properties of charge variants or glycovariants to a parent protein.
Higher order structure comparisons leverage both far- and near-UV wavelength ranges to enable statistically robust, reproducible, and quantifiable data analysis.
Detecting these subtle differences requires multiple independent spectra and robust statistical analysis, as many variations are too small to be discernible by eye.
[25] Fluorescence measurements in CD spectroscopy, recorded at a 90 degree angle to the incident light, often serve as a complementary data channel, providing additional insights into protein stability and conformational changes.
By detecting intrinsic fluorescence from aromatic residues such as tryptophan and tyrosine, researchers can assess environmental shifts that accompany structural transitions.
Fluorescence data can be acquired alongside CD signals, particularly in temperature ramp experiments, where it helps monitor unfolding events by tracking changes in emission intensity or wavelength shifts.
This dual approach enhances the interpretation of protein behavior under varying conditions, improving confidence in structural and stability assessments.
ORD is particularly useful for unsubstituted sugars as this class of biomolecule does not possess chromophores that absorb in the UV-Vis regions accessible via commercial CD instruments.
The sample is contained in the annular gap between two concentric quartz cylinders, the outer of which, the rotor, is rotated about its cylindrical axis, while the inner, the stator, is stationary.
For example, rigid, rod-like particles, such as carbon nanotubes and glass fibers, will align, whereas vesicles, micelles, and flexible polymers will deform from their equilibrium conformations, extending in the direction of shear.
To eliminate the effect of anisotropy, the sample is usually mounted in a wheel and can be manually rotated to allow measurements to be made at several angular positions.
The change in spectroscopic signal as a function of time is recorded, and the rate constants that define the reaction kinetics can then be obtained by fitting the data using a suitable model.
Buffer salts also exhibit surprisingly high absorbance at the lower end of the far-UV range and it should be endeavored to stay below approximately 50 mM (pathlength dependent).
Once oxygen has been eliminated, perhaps the second most important technical factor in working below 200 nm is to design the rest of the optical system to have low losses in this region.

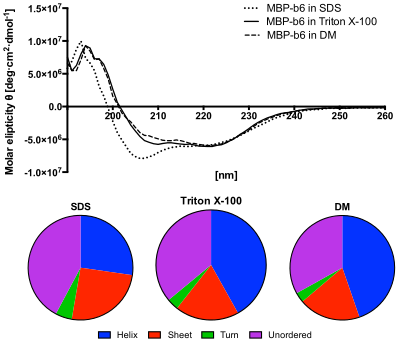
Lower panel: The content of secondary structures predicted from the CD spectra using the CDSSTR algorithm. The protein in SDS solution shows increased content of unordered structures and decreased helices content. [ 12 ]

