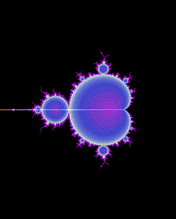
Buddhabrot
The Buddhabrot is the probability distribution over the trajectories of points that escape the Mandelbrot fractal.
Its name reflects its pareidolic resemblance to classical depictions of Gautama Buddha, seated in a meditation pose with a forehead mark (tika), a traditional oval crown (ushnisha), and ringlet of hair.
The Buddhabrot rendering technique was discovered by Melinda Green,[1] who later described it in a 1993 Usenet post to sci.fractals.
[2] Previous researchers had come very close to finding the precise Buddhabrot technique.
In 1988, Linas Vepstas relayed similar images[3] to Cliff Pickover for inclusion in Pickover's then-forthcoming book Computers, Pattern, Chaos, and Beauty.
This led directly to the discovery of Pickover stalks.
Noel Griffin also implemented this idea in the 1993 "Mandelcloud" option in the Fractint renderer.
However, these researchers did not filter out non-escaping trajectories required to produce the ghostly forms reminiscent of Hindu art.
Green first named this pattern Ganesh, since an Indian co-worker "instantly recognized it as the god 'Ganesha' which is the one with the head of an elephant.
"[2] The name Buddhabrot was coined later by Lori Gardi.
in the complex plane for which the iteratively defined sequence
For points which do escape within a chosen maximum number of iterations, and therefore are not in the Mandelbrot set, the counter for each box entered during the escape to infinity is incremented by 1.
Points which do not escape within the maximum number of iterations (and considered to be in the Mandelbrot set) are discarded.
The result is a density plot highlighting regions where
This is partly due to requiring more random points to be iterated than pixels in the image in order to build up a sharp image.
Rendering highly zoomed areas requires even more computation than for standard Mandelbrot images in which a given pixel can be computed directly regardless of zoom level.
Without resorting to more complex probabilistic techniques,[5] rendering zoomed portions of Buddhabrot consists of merely cropping a large full sized rendering.
The maximum number of iterations chosen affects the image – higher values give sparser more detailed appearance, as a few of the points pass through a large number of pixels before they escape, resulting in their paths being more prominent.
The number of samples chosen also affects the image as not only do higher sample counts reduce the noise of the image, they can reduce the visibility of slowly moving points and small attractors, which can show up as visible streaks in a rendering of lower sample count.
Green later realized that this provided a natural way to create color Buddhabrot images by taking three such grayscale images, differing only by the maximum number of iterations used, and combining them into a single color image using the same method used by astronomers to create false color images of nebula and other celestial objects.
Some have labelled Buddhabrot images using this technique Nebulabrots.
The relationship between the Mandelbrot set as defined by the iteration
The traditional way of illustrating this relationship is aligning the logistic map and the Mandelbrot set through the relation between
, using a common x-axis and a different y-axis, showing a one-dimensional relationship.
Melinda Green discovered that the Anti-Buddhabrot paradigm fully integrates the logistic map.
Both are based on tracing paths from non-escaping points, iterated from a (random) starting point, and the iteration functions are related by the transformation given above.
, simply generates the logistic map in the plane
Because both the Mandelbrot set and the logistic map are an integral part of the Anti-Buddhabrot we can now show a 3D relationship between both, using the 3D axes
We could rotate an extra 180° but this gives the same images, mirrored around the
We emphasize this by showing briefly, at 90° rotation, only the projected plane