Carbon dioxide in Earth's atmosphere
The increase in atmospheric concentrations of CO2 causes a range of further effects of climate change on the environment and human living conditions.
[2] Reconstructed temperature records for the last 420 million years indicate that atmospheric CO2 concentrations peaked at approximately 2,000 ppm.
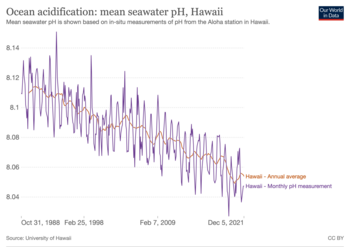
[11] Since the start of the Industrial Revolution, atmospheric CO2 concentration have been increasing, causing global warming and ocean acidification.
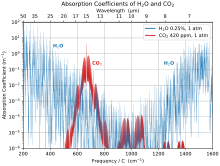
[12] In October 2023 the average level of CO2 in Earth's atmosphere, adjusted for seasonal variation, was 422.17 parts per million by volume (ppm).
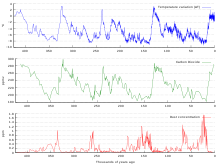
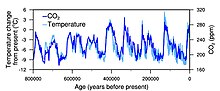
[16] It was pointed out in 2021 that "the current rates of increase of the concentration of the major greenhouse gases (carbon dioxide, methane and nitrous oxide) are unprecedented over at least the last 800,000 years".
Concentrations reach a peak in May as the Northern Hemisphere spring greenup begins, and decline to a minimum in October, near the end of the growing season.
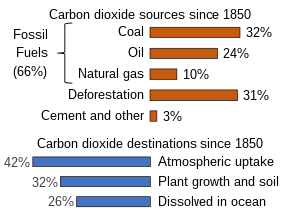
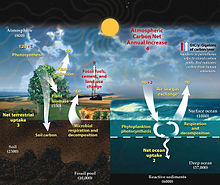
[36] While CO2 absorption and release is always happening as a result of natural processes, the recent rise in CO2 levels in the atmosphere is known to be mainly due to human (anthropogenic) activity.
[3] The extraction and burning of fossil fuels, releasing carbon that has been underground for many millions of years, has increased the atmospheric concentration of CO2.
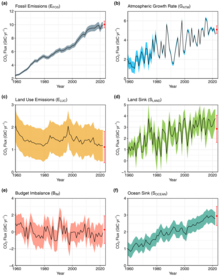
[30][43] Currently about half of the carbon dioxide released from the burning of fossil fuels is not absorbed by vegetation and the oceans and remains in the atmosphere.
[57] A simpler model based on it gives the fraction of CO2 remaining in the atmosphere as a function of the number of years after it is emitted into the atmosphere:[58] According to this model, 21.7% of the carbon dioxide released into the air stays there forever, but of course this is not true if carbon-containing material is removed from the cycle (and stored) in ways that are not operative at present (artificial sequestration).
[59][60] A study published in Science Advances in 2025 concluded that faster flow of the Antarctic Circumpolar Current (ACC) at higher latitudes causes upwelling of isotopically light deep waters around Antarctica, likely increasing atmospheric carbon dioxide levels and thereby potentially constituting a critical positive feedback for future warming.
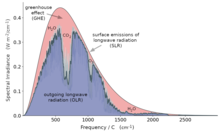
[62] Changes in global temperatures over the past century provide evidence for the effects of increasing greenhouse gases.
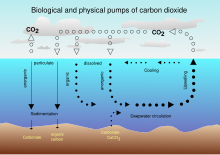
Marine calcifying organisms, such as mollusks and corals, are especially vulnerable because they rely on calcium carbonate to build shells and skeletons.
[75][76] The carbon fertilization effect varies depending on plant species, air and soil temperature, and availability of water and nutrients.
[76][77][85][86] Earth's vegetated lands have shown significant greening since the early 1980s[87] largely due to rising levels of atmospheric CO2.
[88][89][90][91] CO2 emissions have also led to the stratosphere contracting by 400 meters since 1980, which could affect satellite operations, GPS systems and radio communications.
Even if human carbon dioxide emissions were to completely cease, atmospheric temperatures are not expected to decrease significantly in the short term.
[10] However the IPCC Sixth Assessment Report estimated similar levels 3 to 3.3 million years ago in the mid-Pliocene warm period.
[103]: Figure 2.34 Carbon dioxide is believed to have played an important effect in regulating Earth's temperature throughout its 4.54 billion year history.
Early in the Earth's life, scientists have found evidence of liquid water indicating a warm world even though the Sun's output is believed to have only been 70% of what it is today.
Higher carbon dioxide concentrations in the early Earth's atmosphere might help explain this faint young sun paradox.
[2] On long timescales, atmospheric CO2 concentration is determined by the balance among geochemical processes including organic carbon burial in sediments, silicate rock weathering, and volcanic degassing.
The net effect of slight imbalances in the carbon cycle over tens to hundreds of millions of years has been to reduce atmospheric CO2.
On a timescale of billions of years, such downward trend appears bound to continue indefinitely as occasional massive historical releases of buried carbon due to volcanism will become less frequent (as earth mantle cooling and progressive exhaustion of internal radioactive heat proceed further).
The most widely accepted of such studies come from a variety of Antarctic cores and indicate that atmospheric CO2 concentrations were about 260–280 ppm immediately before industrial emissions began and did not vary much from this level during the preceding 10,000 years.
However, various proxy measurements and models suggest larger variations in past epochs: 500 million years ago CO2 levels were likely 10 times higher than now.
These include boron and carbon isotope ratios in certain types of marine sediments, and the numbers of stomata observed on fossil plant leaves.
[126] Earlier still, a 200-million year period of intermittent, widespread glaciation extending close to the equator (Snowball Earth) appears to have been ended suddenly, about 550 Ma, by a colossal volcanic outgassing that raised the CO2 concentration of the atmosphere abruptly to 12%, about 350 times modern levels, causing extreme greenhouse conditions and carbonate deposition as limestone at the rate of about 1 mm per day.
[127] This episode marked the close of the Precambrian Eon, and was succeeded by the generally warmer conditions of the Phanerozoic, during which multicellular animal and plant life evolved.
[132] Low CO2 concentrations may have been the stimulus that favored the evolution of C4 plants, which increased greatly in abundance between 7 and 5 million years ago.