Cartographic generalization
Eduard Imhof, one of the most accomplished academic and professional cartographers at the time, published a study of city plans on maps at a variety of scales in 1937, itemizing several forms of generalization that occurred, including those later termed symbolization, merging, simplification, enhancement, and displacement.
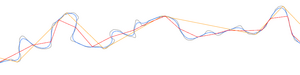
[1] As analytical approaches to geography arose in the 1950s and 1960s, generalization, especially line simplification and raster smoothing, was a target of study.
This is probably because it fit within both of the major two research trends of the era: cartographic communication (especially signal processing algorithms based on Information theory), and the opportunities afforded by technological advance (because of its potential for automation).
[6][7] These tracks foundered somewhat in the late 1990s, coinciding with a general loss of faith in the promise of AI, and the rise of post-modern criticisms of the impacts of the automation of design.
In recent years, the generalization community has seen a resurgence, fueled in part by the renewed opportunities of AI.
[7] In the first, most conceptual phase, McMaster and Shea show how generalization plays a central role in resolving the often conflicting goals of Cartographic design as a whole: functionality vs. aesthetics, information richness vs. clarity, and the desire to do more vs. the limitations of technology and medium.
A map with a strong visual hierarchy (i.e., with less important layers being subdued but still present) carries an aesthetic of being "clear" because it appears at first glance to contain less data than it really does; conversely, a map with no visual hierarchy, in which all layers seem equally important, might be summarized as "cluttered" because one's first impression is that it contains more data than it really does.
In fact, there are multiple reviews comparing the lists,[5][12][14] and even they miss a few salient ones, such as that found in John Keates' first textbook (1973) that was apparently ahead of its time.
[15] Some of these operations have been automated by multiple algorithms, with tools available in Geographic information systems and other software; others have proven much more difficult, with most cartographers still performing them manually.
Also called filter, omission One of the first operators to be recognized and analyzed, first appearing in the 1973 Keates list,[4][15] selection is the process of simply removing entire geographic features from the map.
[16] Most of these algorithms, especially the early ones, placed a higher priority on reducing the size of datasets in the days of limited digital storage, than on quality appearance on maps, and often produce lines that look excessively angular, especially on curves such as rivers.
The difference is that smoothing is designed to make the overall shape of the line look simpler by removing small details; which may actually require more vertices than the original.
For proper interpretation, the map reader must be aware that because of scale limitations combined elements are not perfect depictions of natural or manmade features.
Also called distribution refinement Typify is a symbology operator that replaces a large set of similar features with a smaller number of representative symbols, resulting in a sparser, cleaner map.
Also called Symbolize This operator reduces the Dimension of a feature, such as the common practice of representing cities (2-dimensional) as points (0-dimensional), and roads (2-dimensional) as lines (1-dimensional).
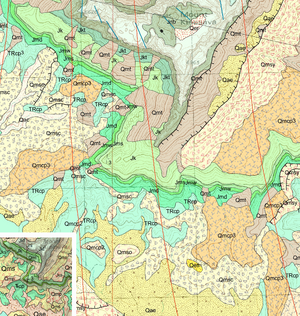
While Categorization is used for a wide variety of purposes, in this case the task is to take a large range of values that is too complex to represent on the map of a given scale, and reduce it to a few categories that is much simpler to represent, especially if geographic patterns result in large regions of the same category.
For discrete fields (also known as categorical coverages or area-class maps) represented as vector polygons, such as land cover, climate type, soil type, city zoning, or surface geology, reclassification often results in adjacent polygons with the same category, necessitating a subsequent dissolve operation to merge them.
A symbology example would be drawing highways as thick lines in a small-scale map that would be miles wide if measured according to the scale.
A common place where this would occur is the cities Brazzaville and Kinshasa on either side of the Congo river in Africa.
Keates (1973) was one of the first to use the modern terms for exaggeration and displacement and discuss their close relationship, but they were recognized as early as Imhof (1937)[1][15] This is the addition of symbols or other details on a smaller scale map to make a particular feature make more sense, especially when such understanding is important the map purpose.
Ideally, agencies responsible for collecting and maintaining spatial data should try to keep only one canonical representation of a given feature, at the highest possible level of detail.
[23] This mapping process can be efficiently and effectively achieved by head/tail breaks,[24][25] a new classification scheme or visualization tool for data with a heavy tailed distribution.