Electronic circuit simulation
Simulation software allows for the modeling of circuit operation and is an invaluable analysis tool.
Electronics simulation software engages its users by integrating them into the learning experience.
In particular, for integrated circuits, the tooling (photomasks) is expensive, breadboards are impractical, and probing the behavior of internal signals is extremely difficult.
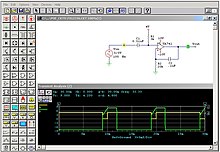
The event-driven algorithm provided by mixed-mode simulators is general-purpose and supports non-digital types of data.
For example, elements can use real or integer values to simulate DSP functions or sampled data filters.
[5] Mixed-mode simulation is handled on three levels: with primitive digital elements that use timing models and the built-in 12 or 16 state digital logic simulator, with subcircuit models that use the actual transistor topology of the integrated circuit, and finally, with inline Boolean logic expressions.
Exact representations are used mainly in the analysis of transmission line and signal integrity problems where a close inspection of an IC’s I/O characteristics is needed.
These two modeling techniques use SPICE to solve a problem while the third method, digital primitives, uses mixed mode capability.
Another type of simulation used mainly for power electronics represent piecewise linear[6] algorithms.
These algorithms use an analog (linear) simulation until a power electronic switch changes its state.
A fifth order, 50 ohm, Chebyshev filter with 1dB of pass band ripple and cutoff frequency of 1GHz designed using the Chebyshev Cauar topology and subsequent impedance and frequency scaling produces the elements shown in the table and Micro-cap schematic below.
50 ohms and 1GHz The table above provides a list of ideal elements to model along with a node attachments to simulate.
With transmission lines and real world inductor and capacitor models, for example, Y11 != -Y12, and for some more complex passive asymmetric elements Y11 != Y22.
Therefore, the example in this section uses independent Y11, Y12, Y21, and Y22 to illustrate the simulation processes that applies to more complex real world devices.
Each element Y parameter is inserted into the nodal admittance matrix by summing in them into the nodes they are attached to following the rules below.
[9] If the second node is not 0, that is, not a ground: The table below shows the Chebyshev element 2x2 Y parameters summed in at the appropriate locations.
The table below shows the reduced Y parameter matrix of the Chebyshev filter example simulation after nodes 2 and 4 are eliminated.
Since the example Chebyshev filter design requirement is for -1dB attenuation at the cutoff frequency of 1GHz, |S12| at 1 GHz is expected to be -1dB.
The final validity test for the example is to simulate the Chebyshev filter frequency response through the full useful range, which will be taken to be 100 MHz to 5 GHz for this case.
For example, a port with a resistance of 1e-09 in a network that is terminated elsewhere by 50 ohms would model an ideal source with sufficient accuracy.