Climate change in Uganda
The effects of climate change in Uganda are increasingly severe, affecting the lives of the country's citizens and its environment.
In 2012, forest fires occurred in the Rwenzori region, causing the ice fields to melt, leading to the flooding of the river around the mountain.
[9] In January 2022, intense rain around Mount Muhavura damaged buildings and roads in Kisoro District,[10] especially affecting Nyarusiza, Muramba and Bunagana.
[12][13] On 1 March 2010, landslides occurred on the slopes of Mount Elgon, in the Bududa district, that killed 50 people and left thousands displaced.
[16] In Kasese District, there is flooding almost every year, which causes a heavy impact on the lives and livelihood of residents.
[27] This has reduced both the ecosystem services the forests provide, including by diminishing wood yield and quality, and the biodiversity they support.
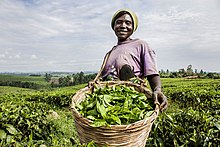
[27] Uganda's economy consists of three major sectors, agriculture, industry, and services, all of which are highly vulnerable to the effects of climate change.
[28] Climate change is affecting the agricultural sector by reducing the area suitable for agriculture due to population growth, altering the length of the growing season, reducing yield potential, increasing the frequency and severity of extreme events (in particular droughts and floods), and increasing the incidence of plant diseases.
[28] Climate change damage estimates in the agriculture, water, infrastructure and energy sectors collectively amount to 2–4% of the GDP between 2010 and 2050.
[32] The Ugandan manufacturing sector is dominated by agro-processing, food and beverages, household products, construction materials and fast-moving consumer goods.
Most products manufactured in Uganda are aimed at domestic consumption, and exports are limited to the regional markets in East Africa, including Rwanda, Burundi, South Sudan, Democratic Republic of the Congo (DRC), and the regions of Kenya and Tanzania bordering Uganda.