Analytic signal
[1] The real and imaginary parts of an analytic signal are real-valued functions related to each other by the Hilbert transform.
The basic idea is that the negative frequency components of the Fourier transform (or spectrum) of a real-valued function are superfluous, due to the Hermitian symmetry of such a spectrum.
These negative frequency components can be discarded with no loss of information, provided one is willing to deal with a complex-valued function instead.
That makes certain attributes of the function more accessible and facilitates the derivation of modulation and demodulation techniques, such as single-sideband.
As long as the manipulated function has no negative frequency components (that is, it is still analytic), the conversion from complex back to real is just a matter of discarding the imaginary part.
The analytic representation is a generalization of the phasor concept:[2] while the phasor is restricted to time-invariant amplitude, phase, and frequency, the analytic signal allows for time-variable parameters.
is the real value denoting frequency), then the transform has Hermitian symmetry about the
And the operation is reversible, due to the Hermitian symmetry of
this can also be expressed as a filtering operation that directly removes negative frequency components: Since
, restoring the negative frequency components is a simple matter of discarding
restores the suppressed positive frequency components.
operator removes the subtraction, giving the appearance of adding new components.
In general, the analytic representation of a simple sinusoid is obtained by expressing it in terms of complex-exponentials, discarding the negative frequency component, and doubling the positive frequency component.
Here we use Euler's formula to identify and discard the negative frequency.
Then: This is another example of using the Hilbert transform method to remove negative frequency components.
But it might not be a reversible representation, because the original spectrum is not symmetrical in general.
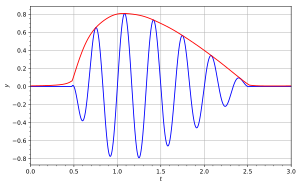
Then: An analytic signal can also be expressed in polar coordinates: where the following time-variant quantities are introduced: In the accompanying diagram, the blue curve depicts
The polar coordinates conveniently separate the effects of amplitude modulation and phase (or frequency) modulation, and effectively demodulates certain kinds of signals.
Analytic signals are often shifted in frequency (down-converted) toward 0 Hz, possibly creating [non-symmetrical] negative frequency components:
The complex envelope is not unique; it is determined by the choice of
Then a simple low-pass filter with real coefficients can excise the portion of interest.
A frequency shift does not undermine the mathematical tractability of the complex signal representation.
However, restoring the real-valued representation is no longer a simple matter of just extracting the real component.
Up-conversion may be required, and if the signal has been sampled (discrete-time), interpolation (upsampling) might also be necessary to avoid aliasing.
Other choices of reference frequency are sometimes considered: In the field of time-frequency signal processing, it was shown that the analytic signal was needed in the definition of the Wigner–Ville distribution so that the method can have the desirable properties needed for practical applications.
as defined above is interpreted as a time-dependent generalization of the complex amplitude.
[c] Their relationship is not unlike that in the real-valued case: varying envelope generalizing constant amplitude.
in the Fourier domain and label any frequency vector
The analytic signal is then produced by removing all negative frequencies and multiply the result by 2, in accordance to the procedure described for the case of one-variable signals.
However, the monogenic signal can be extended to arbitrary number of variables in a straightforward manner, producing an (n + 1)-dimensional vector-valued function for the case of n-variable signals.