Correlated color temperature
Correlated color temperature (CCT, Tcp) refers to the temperature of a Planckian radiator whose perceived color most closely resembles that of a given stimulus at the same brightness and under specified viewing conditions.
[3][4][5] In practice, light sources that approximate Planckian radiators, such as certain fluorescent or high-intensity discharge lamps, are assessed based on their CCT, which is the temperature of a Planckian radiator whose color most closely resembles that of the light source.
For light sources that do not follow the Planckian distribution, aligning them with a black body is not straightforward; thus, the concept of CCT is extended to represent these sources as accurately as possible on a one-dimensional color temperature scale, where "as accurately as possible" is determined within the framework of an objective color space.
The notion of using Planckian radiators as a yardstick against which to judge other light sources is not new.
By means of a projective transformation, Judd found a more "uniform chromaticity space" (UCS) in which to find the CCT.
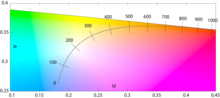
Judd determined the "nearest color temperature" by simply finding the point on the Planckian locus nearest to the chromaticity of the stimulus on Maxwell's color triangle, depicted aside.
[14] Since the isothermal points formed normals on his UCS diagram, transformation back into the xy plane revealed them still to be lines, but no longer perpendicular to the locus.
Judd's idea of determining the nearest point to the Planckian locus on a uniform chromaticity space is current.
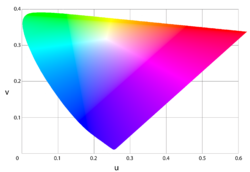
In 1937, MacAdam suggested a "modified uniform chromaticity scale diagram", based on certain simplifying geometrical considerations:[15] This (u,v) chromaticity space became the CIE 1960 color space, which is still used to calculate the CCT (even though MacAdam did not devise it with this purpose in mind).
Before the advent of powerful personal computers, it was common to estimate the correlated color temperature by way of interpolation from look-up tables and charts.
Although the CCT can be calculated for any chromaticity coordinate, the result is meaningful only if the light source somewhat approximates a Planckian radiator.
[21] The CIE recommends that "The concept of correlated color temperature should not be used if the chromaticity of the test source differs more than Δuv = 5×10⁻² from the Planckian radiator.
"[22] Beyond a certain value of Δuv, a chromaticity co-ordinate may be equidistant to two points on the locus, causing ambiguity in the CCT.
If a narrow range of color temperatures is considered—those encapsulating daylight being the most practical case—one can approximate the Planckian locus in order to calculate the CCT in terms of chromaticity coordinates.
Following Kelly's observation that the isotherms intersect in the purple region near (x = 0.325, y = 0.154),[18] McCamy proposed this cubic approximation:[23] where n = (x − xe)/(ye - y) is the inverse slope line, and (xe = 0.3320, ye = 0.1858) is the "epicenter"; quite close to the intersection point mentioned by Kelly.
The maximum absolute error for color temperatures ranging from 2856 K (illuminant A) to 6504 K (D65) is under 2 K. Hernández-André's 1999 proposal, using exponential terms, considerably extends the applicable range by adding a second epicenter for high color temperatures:[24] where n is as before and the other constants are defined below: The author suggests that one use the low-temperature equation to determine whether the higher-temperature parameters are needed.
The paper stresses the importance of also returning the Δuv value for evalulation of light sources.
[25] As it does not use one fixed table, it can be applied to any observer color matching function.
[26] The inverse calculation, from color temperature to corresponding chromaticity coordinates, is discussed in Planckian locus § Approximation.