Default mode network
[4] In the 1970s, David H. Ingvar and colleagues observed blood flow in the front part of the brain became the highest when a person is at rest.
[4] Around the same time, intrinsic oscillatory behavior in vertebrate neurons was observed in cerebellar Purkinje cells, inferior olivary nucleus and thalamus.
[4] In 1995, Bharat Biswal, a graduate student at the Medical College of Wisconsin in Milwaukee, discovered that the human sensorimotor system displayed "resting-state connectivity," exhibiting synchronicity in functional magnetic resonance imaging (fMRI) scans while not engaged in any task.
[14] Raichle coined the term "default mode" in 2001 to describe resting state brain function;[19] the concept rapidly became a central theme in neuroscience.
[20] Around this time the idea was developed that this network of brain areas is involved in internally directed thoughts and is suspended during specific goal-directed behaviors.
One reason for the increase in papers was the robust effect of finding the DMN with resting-state scans and independent component analysis (ICA).
The network can be separated into hubs and subsections: Functional hubs:[25] Information regarding the self Dorsal medial subsystem:[25] Thinking about others Medial temporal subsystem:[25] Autobiographical memory and future simulations The default mode network is most commonly defined with resting state data by putting a seed in the posterior cingulate cortex and examining which other brain areas most correlate with this area.
[19] Independent component analysis (ICA) robustly finds the DMN for individuals and across groups, and has become the standard tool for mapping the default network.
[1] Recent evidence from a population brain-imaging study of 10,000 UK Biobank participants further suggests that each DMN node can be decomposed into subregions with complementary structural and functional properties.
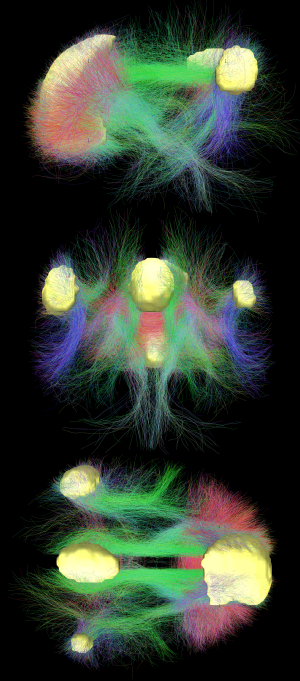
[22] The structural connections found from diffusion MRI imaging and the functional correlations from resting state fMRI show the highest level of overlap and agreement within the DMN areas.
[1] This provides evidence that neurons in the DMN regions are linked to each other through large tracts of axons and this causes activity in these areas to be correlated with one another.
From the point of view of effective connectivity, many studies have attempted to shed some light using dynamic causal modeling, with inconsistent results.
However, directionality from the medial prefrontal cortex towards the posterior cingulate gyrus seems confirmed in multiple studies, and the inconsistent results appear to be related to small sample size analysis.
[31] Electrocorticography studies (which involve placing electrodes on the surface of a subject's cerebral cortex) have shown the default mode network becomes activated within a fraction of a second after participants finish a task.
[41] Gabrielle et al. (2019) suggests that the DMN is related to the perception of beauty, in which the network becomes activated in a generalized way to aesthetically moving domains such as artworks, landscapes, and architecture.
[4][43] In particular, the DMN has also been reported to show overlapping yet distinct neural activity patterns across different mental health conditions, such as when directly comparing attention deficit hyperactivity disorder (ADHD) and autism.
[52] Altered DMN connectivity may change the way a person perceives events and their social and moral reasoning, thus increasing their susceptibility to depressive symptoms.
[53] Lower connectivity between brain regions was found across the default network in people who have experienced long-term trauma, such as childhood abuse or neglect, and is associated with dysfunctional attachment patterns.
Support for this argument comes from studies that show changing in breathing alters oxygen levels in the blood which in turn affects DMN the most.