Resting state fMRI
The resting state approach is useful to explore the brain's functional organization and to examine if it is altered in neurological or mental disorders.
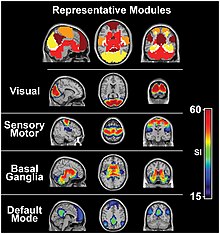
[6][7] Resting-state functional connectivity research has revealed a number of networks which are consistently found in healthy subjects, different stages of consciousness and across species, and represent specific patterns of synchronous activity.
[15] [16] The physiological blood-flow response largely decides the temporal sensitivity, how well neurons that are active can be measured in BOLD fMRI.
The basic time resolution parameter is the sampling rate, or TR, which dictates how often a particular brain slice is excited and allowed to lose its magnetization.
For example, respiratory fluctuations and cardiovascular cycles affect the BOLD signal being measured in the brain and therefore are usually tried to be removed during processing of the raw fMRI data.
Though at the time, Biswal's research was mostly disregarded and attributed to another signal source, his resting neuroimaging technique has now been widely replicated and considered a valid method of mapping functional brain networks.
These include the relative independence of blood flow and oxygen consumption during changes in brain activity, which provided the physiological basis of fMRI, as well the discovery of the well known Default Mode Network.
[25] The default mode network is an interconnected and anatomically defined brain system that preferentially activates when individuals focus on internal tasks such as daydreaming, envisioning the future, retrieving memories, and gauging others' perspectives.
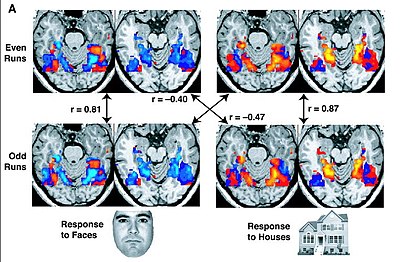
[28] As already reported, these resting-state networks consist of anatomically separated, but functionally connected regions displaying a high level of correlated BOLD signal activity.
[citation needed] Independent component analysis (ICA) is a useful statistical approach in the detection of resting state networks.
These metrics hold great potentials of accelerating biomarker identification for various brain diseases, which call the need of addressing reliability and reproducibility at first place.
When collected from defined ROI's, fMRI data informs researchers of how activity (blood flow) in the brain changes over time or during a task.
[45] This combined data provides unique clinical and neuropsychiatric benefit, by enabling the investigation of how brain networks are disturbed, or white matter pathways compromised, by the presence of mental illness or structural damage.
feel that in order to obtain the best combination of spatial and temporal information from brain activity, both fMRI as well as electroencephalography (EEG) should be used simultaneously.
This dual technique combines the EEG's well documented ability to characterize certain brain states with high temporal resolution and to reveal pathological patterns, with fMRI's (more recently discovered and less well understood) ability to image blood dynamics through the entire brain with high spatial resolution.
[53] The clinical value of these findings is the subject of ongoing investigations, but recent researches suggest an acceptable reliability for EEG-fMRI studies and better sensitivity in higher field scanner.
[55] Potential pitfalls when using rsfMRI to determine functional network integrity are contamination of the BOLD signal by sources of physiological noise such as heart rate, respiration,[56][57] and head motion.
[63] Research using resting state fMRI has the potential to be applied in clinical context, including use in the assessment of many different diseases and mental disorders.
[64] Other types of current and future clinical applications for resting state fMRI include identifying group differences in brain disease, obtaining diagnostic and prognostic information, longitudinal studies and treatment effects, clustering in heterogeneous disease states, and pre-operative mapping and targeting intervention.