Deficit reduction in the United States
CBO reported in July 2014 that the continuation of present tax and spending policies for the long-run (into the 2030s) results in a budget trajectory that causes debt to grow faster than GDP, which is "unsustainable."
Further, CBO reported that high levels of debt relative to GDP may pose significant risks to economic growth and the ability of lawmakers to respond to crises.
[20][21] The CBO reported several types of risk factors related to high and rising debt levels in a July 2010 publication: Reducing the budget deficit by tax increases or spending cuts may slow economic growth.
[54] Senator Elizabeth Warren supports an "Ultra-Millionaire Tax" on the 75,000 richest families in the U.S. (those with incomes greater that $50 million) that would result in an estimated $250 billion per year in federal revenue.
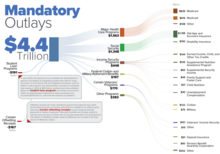
These agencies have indicated that under current law, sometime between 2030 and 2040, mandatory spending (primarily Social Security, Medicare, Medicaid, and interest on the national debt) will exceed tax revenue.
[57] CBO wrote in November 2012: "The aging of the baby-boom generation portends a significant and sustained increase in coming years in the share of the population that will receive benefits from Social Security and Medicare and long-term care services financed through Medicaid.
Without significant changes in the laws governing Social Security, Medicare, and Medicaid, those factors will boost federal outlays as a percentage of GDP well above the average of the past four decades – a conclusion that applies under any plausible assumptions about future trends in demographics, economic conditions, and health care costs.
Topics included obesity, defensive medicine or tort reform, rationing, a shortage of doctors and nurses, intervention vs. hospice, fraud, and use of imaging technology.
These are measured over a 75-year period and infinite horizon by the program's Trustees: CBO estimated in January 2012 that raising the full retirement age for Social Security from 67 to 70 would reduce outlays by about 13%.
[65] Raising the retirement ages in one or both programs brings forth a host of questions around fairness, as some professions are harder to sustain for elderly (e.g., manual labor) and the poor do not have as long a life expectancy as the rich.
Historian Niall Ferguson described the risk that foreign investors would demand higher interest rates as the U.S. debt levels increase over time in a November 2009 interview.
Economic growth offers the "win-win" scenario of higher employment, which increases tax revenue while reducing safety net expenditures for such things as unemployment compensation and food stamps.
Economic growth and job creation are affected by globalization, technology change or automation, international competition, education levels, demographics, trade policy, and other factors.
Conservative organizations such as the U.S. Chamber of Commerce have advocated growth and employment strategies based on a reduction in government regulations; empowering state education systems; teacher pay for performance strategies; training programs better focused on available jobs; creation of a private and public infrastructure bank to finance investments; tax rate reductions for corporations; free trade agreements; and reducing labor union power.
[74][75] Lawrence Summers, Matthew Yglesias and other economists state that at such low rates, government debt borrowing saves taxpayer money, and improves creditworthiness.
She explained further that job growth between 2000 and 2007 was only half what it had been in the preceding three decades, pointing to several studies by other economists indicating globalization and technology change had highly negative effects on certain sectors of the U.S. workforce and overall wage levels.
IMF managing director Christine Lagarde wrote in August 2011: "For the advanced economies, there is an unmistakable need to restore fiscal sustainability through credible consolidation plans.
And it would involve an all-out effort by the Federal Reserve to get the economy moving, with the deliberate goal of generating higher inflation to help alleviate debt problems.
He wrote: "To address both the near- and longer-term [fiscal] issues, the Congress and the Administration should consider replacing the sharp, front-loaded spending cuts required by the sequestration with policies that reduce the federal deficit more gradually in the near term but more substantially in the longer run.
[94] A Centre for Economic Policy Research paper agrees with the conclusion that, "no real liability is created by new fiat money creation, and therefore public debt does not rise as a result.
They included four scenarios designed to prevent the public debt to GDP ratio from exceeding 60%: As of November 2014, there was no major legislation scheduled to expire or take effect projected by CBO to have a material net impact on the budget deficit.
His January 2010 version of the plan includes partial privatization of Social Security, the transition of Medicare to a voucher system, discretionary spending cuts and freezes, and tax reform.
[107] The CBO did an analysis of the resolution (a less rigorous evaluation than full scoring of legislation), estimating that the Path would balance the budget by 2030 and reduce the level of debt held by the public to 10% GDP by 2050, vs. 62% in 2010.
[108] Economist Paul Krugman called it "ridiculous and heartless" due to a combination of income tax rate reductions (which he argued mainly benefit the wealthy) and large spending cuts that would affect the poor and middle classes.
"[117] President Obama outlined his strategy for reducing future deficits in April 2011 and explained why this debate is important: "...as the Baby Boomers start to retire in greater numbers and health care costs continue to rise, the situation will get even worse.
Specific plan elements included: The CBO reported in September 2011 that: "Given the aging of the population and rising costs for health care, attaining a sustainable federal budget will require the United States to deviate from the policies of the past 40 years in at least one of the following ways: During testimony before the Congressional Joint Deficit Reduction Committee in September 2011, CBO Director Douglas Elmendorf counseled members of Congress to make decisions about the role of the federal government, then make policy choices to obtain the revenue necessary to fund those roles, to put the U.S. on a sustainable fiscal path.
Now, there is only one way to square this circle short of magic, and that is to borrow money, and that is what we have done for decades now at the local, state and federal level...So, the next time you accuse Washington of being irresponsible, save some of that blame for yourself and your friends.
"[141] Bernanke wrote in April 2010: "Thus, the reality is that the Congress, the Administration, and the American people will have to choose among making modifications to entitlement programs such as Medicare and Social Security, restraining federal spending on everything else, accepting higher taxes, or some combination thereof.
Economist Bruce Bartlett wrote in December 2009: "Nevertheless, I can't really blame members of Congress for lacking the courage or responsibility to get the budget under some semblance of control.
"[146] A Bloomberg/Selzer national poll conducted in December 2009 indicated that more than two-thirds of Americans favored tax increases on the rich (individuals making over $500,000) to help solve the deficit problem.