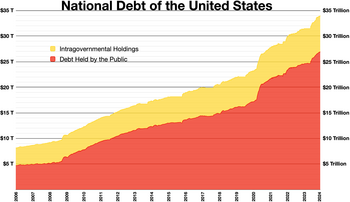
National debt of the United States
[9] [10]Additionally, in recent decades, aging demographics and rising healthcare costs have led to concern about the long-term sustainability of the federal government's fiscal policies.
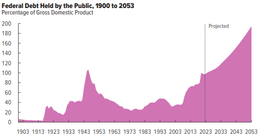
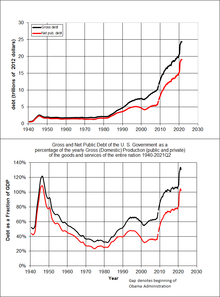
The United States public debt as a percentage of GDP reached its highest level during Harry Truman's first presidential term, during and after World War II.
Public debt as a percentage of GDP fell rapidly in the post-World War II period and reached a low in 1974 under Richard Nixon.
Public debt rose sharply during the 1980s, as Ronald Reagan negotiated with Congress to cut tax rates and increase military spending.
The on- or off-balance sheet obligations of those two independent GSEs was just over $5 trillion at the time the conservatorship was put in place, consisting mainly of mortgage payment guarantees and agency bonds.
[clarification needed] In late 2008, the federal government had guaranteed large amounts of obligations of mutual funds, banks, and corporations under several programs designed to deal with the problems arising from the 2007–2008 financial crisis.
However, an additional $313 billion was required for "the Treasury actions aimed at stabilizing the financial markets," an unusually high amount because of the subprime mortgage crisis.
[49] The CBO estimated the impact of the Tax Cuts and Jobs Act and separate spending legislation over the 2018–2028 period in their annual "Budget & Economic Outlook", released in April 2018: The CBO estimated that the budget deficit for fiscal year 2020 would increase to $3.3 trillion or 16% GDP, more than triple that of 2019 and the largest as % GDP since 1945, because of the impact of the COVID-19 pandemic.
CBO's analysis indicates that even if values for those factors differed from the agency's projections, debt several decades from now would probably be much higher than it is today.
[51] Such low rates, outpaced by the inflation rate, occur when the market believes that there are no alternatives with sufficiently low risk, or when popular institutional investments such as insurance companies, pensions, or bond, money market, and balanced mutual funds are required or choose to invest sufficiently large sums in Treasury securities to hedge against risk.
[52][53] Economist Lawrence Summers states that at such low interest rates, government borrowing actually saves taxpayer money and improves creditworthiness.
[60] A Centre for Economic Policy Research paper agrees with the conclusion that "no real liability is created by new fiat money creation and therefore public debt does not rise as a result.
"[61] The CBO reported several types of risk factors related to rising debt levels in a July 2010 publication: The U.S. has never fully defaulted.
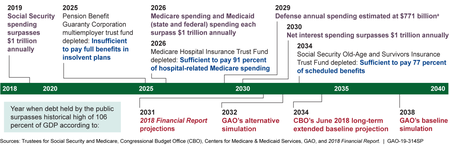
[69][70] In 2009 the Government Accountability Office (GAO) reported that the United States was on a "fiscally unsustainable" path because of projected future increases in Medicare and Social Security spending.
[74] In April 2013, the conclusions of Rogoff and Reinhart's study came into question when a coding error in their original paper was discovered by Herndon, Ash and Pollin of the University of Massachusetts Amherst.
[75][76] Herndon, Ash and Pollin found that after correcting for errors and unorthodox methods used, there was no evidence that debt above a specific threshold reduces growth.
But given the significant costs and risks associated with a rapidly rising federal debt, our nation should soon put in place a credible plan for reducing deficits to sustainable levels over time.
[88] In October 2023, yields for 10-year Treasury notes breached 5% as traders adjusted their assessment of United States' fiscal position and lowered their expectation that Congress or the White House would take any action to improve it.
[89] According to a 2013 Forbes article, many American and other economic analysts have expressed concerns on the amount of United States government debt the People's Republic of China is holding as part of their reserves.
The report said that the threat would not offer "China deterrence options, whether in the diplomatic, military, or economic realms, and this would remain true both in peacetime and in scenarios of crisis or war.
"[105] Against the backdrop of escalating Sino-U.S. tensions in 2020, Yuzo Sakai, a manager at Ueda Totan Forex Ltd., said that if China undertakes a massive sales of U.S. bonds, investors may flock to the Japanese yen as a safe-haven currency.
Since 2018, China had been gradually decreasing its holdings of U.S. federal debt, bringing the total to $1.07 trillion in June 2020, behind Japan who became the biggest foreign creditor of the United States.
Stephen Nagy, a professor at the International Christian University, said a sell-off by China "might damage the United States in the short term" but also cause "critical economic instability" in the Chinese and global economy.
Jeff Kingston, a professor and director of Asian Studies at Temple University, Japan, echoed the view, adding that dumping would lower the price of U.S. bonds, making it more attractive to other countries.
[114] The COVID-19 pandemic in the United States impacted the economy significantly beginning in March 2020, as businesses were shut-down and furloughed or fired personnel.
In particular, the act authorizes the Secretary of the Treasury to provide up to $454 billion to fund emergency lending facilities established by the Board of Governors of the Federal Reserve System.
[122] Many economists have agreed that this unprecedented level of spending from the Biden Administration has, in part, contributed to the inflation spike from 2021 to 2022 as a result of increasing the money supply in the economy.
The following is a list of the top foreign holders of Treasury securities as listed by the Federal Reserve Board (revised by November 2024 survey):[150] A 1998 Brookings Institution study published by the Nuclear Weapons Cost Study Committee (formed in 1993 by the W. Alton Jones Foundation), calculated that total expenditures for U.S. nuclear weapons from 1940 to 1998 was $5.5 trillion in 1996 Dollars.
Sources: Eurostat,[163] International Monetary Fund, World Economic Outlook (emerging market economies); Organisation for Economic Co-operation and Development, Economic Outlook (advanced economies),[164] IMF[165] 1China, Hong Kong, India, Indonesia, Korea, Malaysia, the Philippines, Singapore and Thailand 2Afghanistan, Armenia, Australia, Azerbaijan, Bangladesh, Bhutan, Brunei Darussalam, Cambodia, China, People's Republic of, Fiji, Georgia, Hong Kong SAR, India, Indonesia, Japan, Kazakhstan, Kiribati, Korea, Republic of, Kyrgyz Republic, Lao P.D.R., Macao SAR, Malaysia, Maldives, Marshall Islands, Micronesia, Fed.
States of, Mongolia, Myanmar, Nauru, Nepal, New Zealand, Pakistan, Palau, Papua New Guinea, Philippines, Samoa, Singapore, Solomon Islands, Sri Lanka, Taiwan, Tajikistan, Thailand, Timor-Leste, Tonga, Turkey, Turkmenistan, Tuvalu, Uzbekistan, Vanuatu, Vietnam On July 30, 2015, the BEA released a revision to 2012–2015 GDP figures.
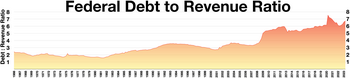
The federal government has a 6.75 to 1 debt to revenue ratio as of Q2 2023.

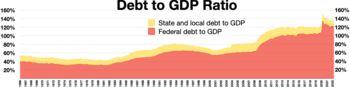

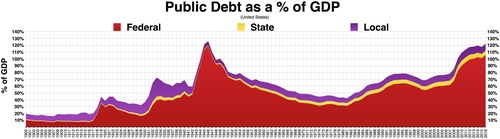
Federal, State, and Local debt and a percentage of GDP chart/graph


April 2021 - April 2022


Quarterly data annualized


