Demographics of Canada
[11] Between 2011 and May 2016, Canada's population grew by 1.7 million people, with immigrants accounting for two-thirds of the increase.
[12] Canada has one of the highest per-capita immigration rates in the world,[13] driven mainly by economic policy and, to a lesser extent, family reunification.
New immigrants to Canada settle mostly in major urban areas such as Toronto, Montreal, and Vancouver.
[21][22] The vast majority of Canadians are positioned in a discontinuous band within approximately 300 km of the southern border with the United States; the most populated province is Ontario, followed by Quebec and British Columbia.
In 2020, Canada also experienced the country's lowest number of births in 15 years,[30] also seeing the largest annual drop in childbirths (−3.6%) in a quarter of a century.
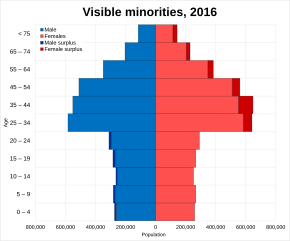
School life expectancy (primary to tertiary education) Infant mortality rate Population by Sex and Age Group (Census 10.V.2016) (To ensure confidentiality, the values, including totals are randomly rounded either up or down to a multiple of '5' or '10.'
For example, as of September 25 2024, The numbers are final up to December 2021, updated from January 2022 to March 2024 and preliminary from April 2024.
"Canadian" as an ethnic group has since 1996 been added to census questionnaires for possible ancestral origin or descent.
Respondents generally are visibly European (Anglophones and Francophones) and no longer self-identify directly with their ethnic ancestral origins.
[54] As data is completely self-reported, and reporting individuals may have varying definitions of "Ethnic origin" (or may not know their ethnic origin), these figures should not be considered an exact record of the relative prevalence of different ethno-cultural ancestries but rather how Canadians self-identify.
For example, there are both Punjabis and Muhajirs from Pakistan, both Turks and Kurds from Turkey and both Sinhalese and Tamil from Sri Lanka.
Immigrants from Iran are divided into Mazandaranians, Azeris, Persians, Kurds, Gilaks and Lurs.
[94] Since confederation in 1867 through to the contemporary era, decadal and demi-decadal census reports have detailed immigration statistics.
[104] 29.9% were Catholic while 11.4% were Protestant (all other listed denominations excluding Christian Orthodox, Latter Day Saints and Jehovah's Witnesses).