Learning curve
A learning curve is a graphical representation of the relationship between how proficient people are at a task and the amount of experience they have.
[2][3] In fact, the gradient of the curve has nothing to do with the overall difficulty of an activity, but expresses the expected rate of change of learning speed over time.
[citation needed] The learning curve may refer to a specific task or a body of knowledge.
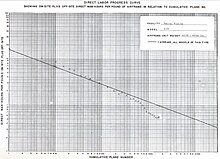
[4][5] In 1936 Theodore Paul Wright described the effect of learning on production costs in the aircraft industry.
[6] This form, in which unit cost is plotted against total production, is sometimes called an experience curve, or Wright's law.
Hermann Ebbinghaus' memory tests, published in 1885, involved memorizing series of nonsense syllables, and recording the success over a number of trials.
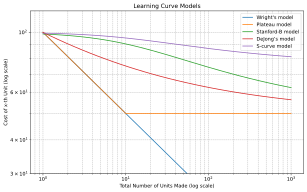
[12][13] Research by BCG in the 1970s observed experience curve effects for various industries that ranged from 10 to 25 percent.
The economic learning of productivity and efficiency generally follows the same kinds of experience curves and have interesting secondary effects.
Efficiency and productivity improvement can be considered as whole organization or industry or economy learning processes, as well as for individuals.
The general pattern is of first speeding up and then slowing down, as the practically achievable level of methodology improvement is reached.
The effect of reducing local effort and resource use by learning improved methods often has the opposite latent effect on the next larger scale system, by facilitating its expansion, or economic growth, as discussed in the Jevons paradox in the 1880s and updated in the Khazzoom-Brookes Postulate in the 1980s.
A comprehensive understanding of the application of learning curve on managerial economics would provide plenty of benefits on strategic level.
[17] Balachander and Srinivasan used to study a durable product and its pricing strategy on the principles of the learning curve.
Konstantaras, Skouri, and Jaber [21] applied the learning curve on demand forecasting and the economic order quantity.
For the performance of one person in a series of trials the curve can be erratic, with proficiency increasing, decreasing or leveling out in a plateau.
[27] The machine learning curve is useful for many purposes including comparing different algorithms,[28] choosing model parameters during design,[29] adjusting optimization to improve convergence, and determining the amount of data used for training.
It has now also become associated with the evolutionary theory of punctuated equilibrium and other kinds of revolutionary change in complex systems generally, relating to innovation, organizational behavior and the management of group learning, among other fields.
[31] These processes of rapidly emerging new form appear to take place by complex learning within the systems themselves, which when observable, display curves of changing rates that accelerate and decelerate.
[32] These practical experiences match the predictions of the second law of thermodynamics for the limits of waste reduction generally.
Approaching limits of perfecting things to eliminate waste meets geometrically increasing effort to make progress, and provides an environmental measure of all factors seen and unseen changing the learning experience.
[3][33] The common English usage aligns with a metaphorical interpretation of the learning curve as a hill to climb.
The term learning curve with meanings of easy and difficult can be described with adjectives like short and long rather than shallow and steep.