Direct linear plot
In biochemistry, the direct linear plot is a graphical method for enzyme kinetics data following the Michaelis–Menten equation.
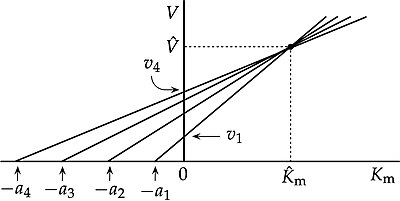
[1] In this plot, observations are not plotted as points, but as lines in parameter space with axes
is represented by a straight line with intercept
Ideally (in the absence of experimental error) the lines intersect at a unique point
whose coordinates provide the values of
are all plots in observation space, with each observation represented by a point, and the parameters determined from the slope and intercepts of the lines that result.
This is also the case for non-linear plots, such as that of
, often wrongly called a "Michaelis-Menten plot", and that of
[6] In contrast to all of these, the direct linear plot is a plot in parameter space, with observations represented by lines rather than as points.
The case illustrated above is idealized, because it ignores the effect of experimental error.
observations, instead of a unique point of intersection, there is a family of
intersection points, with each one giving a separate estimate of
[7] Some of these, when the intersecting lines are almost parallel, will be subject to very large errors, so one must not take the means (weighted or not) as the estimates of
The great majority of intersection points should occur in the first quadrant (both
[note 1] Intersection points in the second quadrant (
positive) do not require any special attention.
negative) should not be taken at face value, because these can occur if both
values are large enough to approach
[note 2] The illustration is drawn for just four observations, in the interest of clarity, but in most applications there will be much more than that.
Determining the location of the medians by inspection becomes increasingly difficult as the number of observations increases, but that is not a problem if the data are processed computationally.
In any case, if the experimental errors are reasonably small, as in Fig.
1b of a study of tyrosine aminotransferase with seven observations,[8] the lines crowd closely enough together around the point
for this to be located with reasonable precision.
The major merit of the direct linear plot is that median estimates based on it are highly resistant to the presence of outliers.
If the underlying distribution of errors in
is not strictly Gaussian, but contains a small proportion of observations with abnormally large errors, this can have a disastrous effect on many regression methods, whether linear or non-linear, but median estimates are very little affected.
[7] In addition, to give satisfactory results regression methods require correct weighting: do the errors
follow a normal distribution with uniform standard deviation, or uniform coefficient of variation, or something else?
This is very rarely investigated, so the weighting is usually based on preconceptions.
Atkins and Nimmo[9] made a comparison of different methods of fitting the Michaelis-Menten equation, and concluded that We have therefore concluded that, unless the error is definitely known to be normally distributed and of constant magnitude, Eisenthal and Cornish-Bowden's method[note 3] is the one to use.