Dot distribution map
It has been claimed that the first dot distribution map was created by Valentine Seaman in a 1797 article analyzing a recent outbreak of yellow fever in New York City.
Although the relatively small number of case locations is not in keeping with the typical use of this technique to visualize the overall distribution of a large number of individuals, it is still noteworthy as possibly the first instance of using a map as an analytical and communication tool for social science, of spatial analysis, and of epidemiology (even though his conclusions turned out to be incorrect).
[4] The earliest known district-based dot density map was created in 1830 by Armand Joseph Frère de Montizon (1788–????
[9] The point feature map was also reinvented in the mid-19th century, with epidemiology again being a leading driver, especially the search for the cause of cholera, which was recognized as occurring in clear geographic patterns.
Shapter did not go so far as identifying the cause of the disease clusters he observed, his map was influential; John Snow later cited it as an inspiration for his own work.
When a large outbreak occurred in London in 1854, Dr. John Snow collected data about the individual cases, especially their location in Soho, using nascent methods of spatial analysis and contact tracing to conclude that contaminated water was the disease vector, and successfully had the source shut off.
The dot density method became standardized during this period, and design guidelines developed,[16] such that the technique could be taught in the cartography textbooks of the mid-20th century.
A significant technological advance has been the availability of very large datasets, such as millions of geocoded social media posts, and innovations in how to visualize them.
Although they use very different techniques, based on very different data sources, with a different semantics in the result, the general purpose is the same: to visualize the geographic distribution of a group phenomenon (i.e. a large number of individuals).
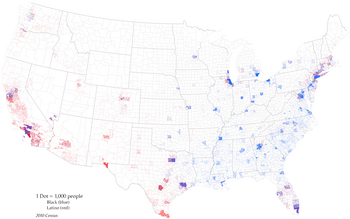
A one-to-one dot map displays the a large number of point symbols representing the locations individual occurrences of a phenomenon.
Many kinds of maps display geographic features as point symbols, such as cities; this category only applies to those that show a large number of instances, each portrayed anonymously (e.g. not labeled), so that attention is focused on the overall distribution rather than on individuals.
[24][26][18] The term one-to-many has become problematic as interactive maps have been developed that use this method but with each dot representing a single person,[27] although this is often criticized for creating the illusion of knowing the location of each individual.
[16] Since then, improving technology in generating dots and printing or displaying them has led to modifications of the balance calculation, which has been automated in most GIS software.
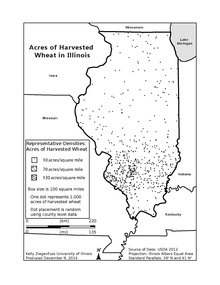
Another design challenge can happen with the one-to-one type of map when multiple points occur at the same location, giving a false impression of lower density (i.e., looking like one dot instead of many).
[18] Automated algorithms have been developed that mimic this technique, using ancillary information such as city point locations to alter the distribution of dots across each district, although they are not widely implemented in GIS software.