Electron crystallography
The general approach dates back to the work in 1924 of Louis de Broglie in his PhD thesis Recherches sur la théorie des quanta[3] where he introduced the concept of electrons as matter waves.
The wave nature was experimentally confirmed for electron beams in the work of two groups, the first the Davisson–Germer experiment,[4][5][6][7] the other by George Paget Thomson and Alexander Reid.
Very quickly there were multiple advances, for instance Seishi Kikuchi's observations of lines that can be used for crystallographic indexing due to combined elastic and inelastic scattering,[13] gas electron diffraction developed by Herman Mark and Raymond Weil,[14][15] diffraction in liquids by Louis Maxwell,[16] and the first electron microscopes developed by Max Knoll and Ernst Ruska.
John M Cowley explains in a 1968 paper:[22]Thus was founded the belief, amounting in some cases almost to an article of faith, and persisting even to the present day, that it is impossible to interpret the intensities of electron diffraction patterns to gain structural information.This has slowly changed.
A second key set of work was that by the group of Boris Vainshtein who demonstrated solving the structure of many different materials such as clays and micas using powder diffraction patterns, a success attributed to the samples being relatively thin.
One of the key steps was the demonstration in 1976 by Douglas L. Dorset and Herbert A. Hauptman that conventional direct methods for x-ray crystallography could be used.
[34] Another was the demonstration in 1986 that a Patterson function could be powerful in the seminal solution of the silicon (111) 7x7 reconstructed surface by Kunio Takanayagi using ultra-high vacuum electron diffraction.
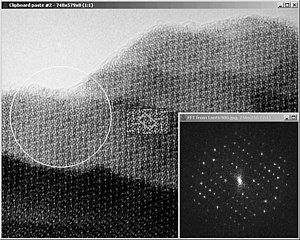
The Fourier transform of an atomic resolution image is similar, but different, to a diffraction pattern—with reciprocal lattice spots reflecting the symmetry and spacing of a crystal.
[43] Aaron Klug was the first to realize that the phase information could be read out directly from the Fourier transform of an electron microscopy image that had been scanned into a computer, already in 1968.
The first electron crystallographic protein structure to achieve atomic resolution was bacteriorhodopsin, determined by Richard Henderson and coworkers at the Medical Research Council Laboratory of Molecular Biology in 1990.
Since then, several other high-resolution structures have been determined by electron crystallography, including the light-harvesting complex,[47] the nicotinic acetylcholine receptor,[48] and the bacterial flagellum.
[60][61] The utmost care must be taken to record such ED patterns from the thinnest areas in order to keep most of the structure related intensity differences between the reflections (quasi-kinematical diffraction conditions).
[63][64] Recent progress for structure analysis by ED was made by introducing the Vincent-Midgley[65] precession technique for recording electron diffraction patterns.
[69][70] Crystal structures determined via electron crystallography can be checked for their quality by using first-principles calculations within density functional theory (DFT).