Energy in the United States
[4] The country had a per capita energy consumption of 295 million BTU (311 GJ), ranking it tenth in the world behind Canada, Norway, and several Arabian nations.
[5][6] The United States' portion of the electrical grid in North America had a nameplate capacity of 1,280 GW[7] and produced 4,029 TWh[8] in 2023, using 34% of primary energy to do so.
[14] Petroleum and natural gas took its place, as car ownership doubled in the two decades after the war,[15] and as the number of pipelines rose dramatically.
[18] Fossil fuels have long produced most energy in the US, accounting for 84% of total production[22] and 60% of electric generation as of 2023.
In contrast, net exports have remained near 2 quads in the same time period, but this now amounts to 17% of total production.
[26] The decline of coal has many factors, including the aforementioned rise of natural gas, the closing of old plants, and environmental regulations.
[26] The United States has been the world's largest producer of natural gas since 2011, when it surpassed Russia.
[4] During the 2023-24 winter heating season in the United States, natural gas inventories ended at 2,290 billion cubic feet (Bcf), 39% above the five-year average, due to mild weather resulting in reduced consumption.
By March 2024, the Henry Hub spot price had decreased to $1.50 per million British thermal units (MMBtu), significantly below the forecasted $3.10/MMBtu, with expectations of prices staying below $2.00/MMBtu until the second half of 2024, averaging $2.20/MMBtu for the year[34] Crude oil made up 24% of production in 2021.
[41] Renewable energy in the United States accounted for 12.5% of the total production in 2021,[22] and 20.7% of electric generation.
For ethanol, about 40% of the available energy is lost or diverted to co-products during the manufacturing process,[44] and the equivalent of 20% is used to power and run the equipment.
[20] The desire for ethanol originated from the need to replace methyl tert-butyl ether, which was contaminating groundwater.
[51] Wood made up the majority of energy consumption until near the end of the 1800s, after which it declined in total use for several decades, to about half its peak.
While hydro has maintained generation in the 200 to 350 TWh range for the past few decades, its share of the total has declined as other sources have risen.
[57] The Bath County Pumped Storage Station is the second-largest such facility in the world, with a capacity of 3,003 MW.
[36] Three states made up over half of total grid generation: California (30%), Texas (13%) and North Carolina (9%).
[53] The US grid produces significantly more wind power than Germany or India, but less than half of China.
A survey from 2018 estimated that the largest energy users were the chemical industry (30%), petroleum and coal processing (18%), mining (9%) and paper (9%).
Each of these handles energy sources as part of their raw materials (fossil fuels and wood).
[63] The same survey found that half of the electric use was to drive machines and about 10% each for heating, cooling and electro-chemical processes.
[65] Diesel and heavier trucks each made up about a quarter of their respective categories; jet fuel and aircraft were about a tenth each.
[70] Most homes in the US are single-family detached,[71] which on average use almost triple the energy of apartments in larger buildings.
Usage per square foot of living space is roughly equal for most housing types except small apartment buildings and mobile homes.
Small apartments are more likely to be older than other housing types,[73] while mobile homes tend to have poor insulation.
[75] Residential prices follow a similar trend, but the differences between states are usually less drastic.
Although single-family detached homes are less common in the Northeast, the average house there uses 60% more energy than one in the West.
Similarly, areas with more homes in a compact neighborhood encourage walking, biking and transit, thereby reducing transportation energy use.
[8] Fossil fuels made up the majority of generation, with natural gas providing 38% and coal 23%.
[7] The following table summarizes the electrical energy generated by fuel source for the United States grid in 2021.
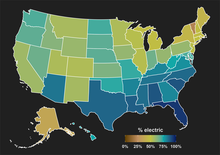
Twelve states use nuclear power more than average, and California and Hawaii each use more solar and petroleum, respectively.