Expenditures in the United States federal budget
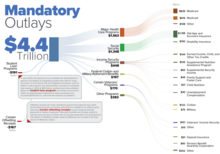
Bowles–Simpson Commission 2007–2008 financial crisis 2013 budget sequestration Related events The United States federal budget consists of mandatory expenditures (which includes Medicare and Social Security), discretionary spending for defense, Cabinet departments (e.g., Justice Department) and agencies (e.g., Securities & Exchange Commission), and interest payments on debt.
The Congressional Budget Office (CBO) reports the costs of mandatory spending programs in a variety of annual and special topic publications.
This is a convention rather than a substantive distinction, since the programs, such as Food Stamps, would continue to be funded even if the appropriation bill were to be vetoed or otherwise not enacted.
[5] Over the past 40 years, mandatory spending for programs like Medicare and Social Security has grown as a share of the budget and relative to GDP, while other discretionary categories have declined.
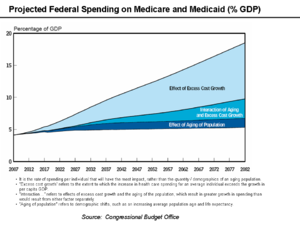
[5] In the long-run, expenditures related to Social Security, Medicare, and Medicaid are growing considerably faster than the economy overall as the population matures.
[10][11][12] Social Security and Medicare expenditures are funded by permanent appropriations and so are considered mandatory spending according to the 1997 Budget Enforcement Act (BEA).
[23] In 2012, 35% of the U.S. population lived in a household that received government benefits, counting only means-tested programs such as food stamps, housing assistance and Medicaid.
The unfavorable combination of demographics and per-capita rate increases is expected to drive both Social Security and Medicare into large deficits during the 21st century.
Multiple government sources have argued these programs are fiscally unsustainable as presently structured due to the extent of future borrowing and related interest required to fund them; here is a 2009 summary from the Social Security and Medicare Trustees: The financial condition of the Social Security and Medicare programs remains challenging.
Social Security's annual surpluses of tax income over expenditures are expected to fall sharply this year and to stay about constant in 2010 because of the economic recession, and to rise only briefly before declining and turning to cash flow deficits beginning in 2016 that grow as the baby boom generation retires.
The deficits will be made up by redeeming trust fund assets until reserves are exhausted in 2037, at which point tax income would be sufficient to pay about three fourths of scheduled benefits through 2083.
In addition, the Medicare Supplementary Medical Insurance (SMI) Trust Fund that pays for physician services and the prescription drug benefit will continue to require general revenue financing and charges on beneficiaries that grow substantially faster than the economy and beneficiary incomes over time.
[10]Since the government borrowed and spent the trust funds' assets, there is no "lockbox" or marketable investment portfolio of $2.4 trillion for Social Security or $380 billion for Medicare.
It consists of four distinct parts which are funded differently: Various reform strategies were proposed for healthcare, including Medicare and Medicaid.
[35] There is significant confusion about the program, due in part to the accounting for surplus payroll tax receipts and the agendas of various political constituencies.
A few key points to understand under current law, if no reforms are implemented: Social Security spending will increase sharply over the next decades, largely due to the retirement of the baby boom generation.
[39] In other words, raising the payroll tax rate to about 14.4% during 2009 (from the current 12.4%) or cutting benefits by 13.3% would address the program's budgetary concerns indefinitely; these amounts increase to around 16% and 24% if no changes are made until 2037.
[40] Since recommendations of the Greenspan Commission were adopted in the early 1980s, Social Security payroll taxes have exceeded benefit payments.
Under current law, Social Security payouts would be reduced by 24% at that time, as only payroll taxes are authorized to cover benefits.
For example, CBO estimates that raising the payroll tax by two percentage points (from 12.4% to 14.4%) over 20 years would increase annual program revenues by 0.6% of GDP, solving the 75-year shortfall.
Raising the early retirement age from 62 to 64 has little impact, as those who wait longer to begin receiving benefits get a higher amount.
The GAO financial statements present data on an accrual basis, meaning as expenses are incurred rather than actual cash payments.
[48] The U.S. defense budget (excluding spending for the wars in Iraq and Afghanistan, Homeland Security, and Veteran's Affairs) is around 4% of GDP.
[51] Democratic Congressman Barney Frank called for a significant reduction in the defense budget during February 2009: "The math is compelling: if we do not make reductions approximating 25 percent of the military budget starting fairly soon, it will be impossible to continue to fund an adequate level of domestic activity even with a repeal of Bush's tax cuts for the very wealthy.
I am working with a variety of thoughtful analysts to show how we can make very substantial cuts in the military budget without in any way diminishing the security we need...[American] well-being is far more endangered by a proposal for substantial reductions in Medicare, Social Security or other important domestic areas than it would be by canceling weapons systems that have no justification from any threat we are likely to face.
"[52] U.S. Secretary of Defense Robert Gates wrote in January 2009 that the U.S. should adjust its priorities and spending to address the changing nature of threats in the world: "What all these potential adversaries—from terrorist cells to rogue nations to rising powers—have in common is that they have learned that it is unwise to confront the United States directly on conventional military terms.
For many war-related activities there may be a long lag between the time when budget authority is granted and when payments (outlays) are made by the U.S. Treasury.
Discretionary budget authority is established annually by Congress, as opposed to mandatory spending that is required by laws that span multiple years, such as Social Security or Medicare.
The U.S. Constitution (Article I, Section 8) grants the Congress the authority to "To raise and support armies, but no appropriation of money to that use shall be for a longer term than two years.
President Obama proposed freezing discretionary spending representing approximately 12% of the budget in his 2011 State of the Union address.