Farinograph
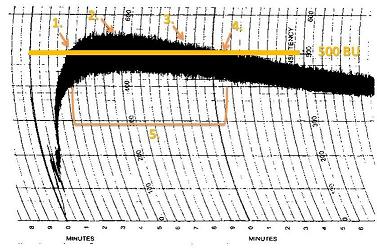
[2] A baker can formulate end products by using the farinograph's results to determine the following:[citation needed] The farinograph is drawn on a curved graph with the vertical axis labeled in Brabender Units (BU) and the horizontal axis labeled as time in minutes.
The graph is generally hockey-stick shaped, with the curve being more or less acute depending on the strength of the gluten in the flour.
The points of interest on the graph are fivefold: The Farinograph is used worldwide by bakers and food technicians in building bakery formulations.
Millers use the Brabender Farinograph to access the properties of the flour, to ascertain whether changes need to be made in the mill.
The miller also uses the farinograph to prepare dough for further testing for extensibility after a resting period (akin to proofing) with the Brabender Extensograph.