Frequency-resolved optical gating
Frequency-resolved optical gating (FROG) is a general method for measuring the spectral phase of ultrashort laser pulses, which range from subfemtosecond to about a nanosecond in length.
Invented in 1991 by Rick Trebino and Daniel J. Kane, FROG was the first technique to solve this problem, which is difficult because, ordinarily, to measure an event in time, a shorter event is required with which to measure it.
For example, to measure a soap bubble popping requires a strobe light with a shorter duration to freeze the action.
Because ultrashort laser pulses are the shortest events ever created, before FROG, it was thought by many that their complete measurement in time was not possible.
Retrieval of the pulse from its FROG trace is accomplished by using a two-dimensional phase-retrieval algorithm.
FROG is currently the standard technique for measuring ultrashort laser pulses replacing an older method called autocorrelation, which only gave a rough estimate for the pulse length.
FROG is simply a spectrally resolved autocorrelation, which allows the use of a phase-retrieval algorithm to retrieve the precise pulse intensity and phase vs. time.
FROG and autocorrelation share the idea of combining a pulse with itself in a nonlinear medium.
FROG extends this idea by measuring the spectrum of the signal at each delay (hence “frequency-resolved”), instead of just the intensity.
This measurement creates a spectrogram of the pulse, which can be used to determine the complex electric field as a function of time or frequency as long as the nonlinearity of the medium is known.
The expression for the trace in terms of the pulse field is then: There are many possible variations on this basic setup.
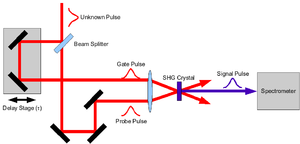
In a typical multi-shot FROG setup, the unknown pulse is split into two copies with a beamsplitter.
In this configuration, it is common to use a home-made spectrometer, consisting of a diffraction grating and a camera, to capture the measurement.
Hence, this section will attempt to give some insight into the basic philosophy and implementation of the method, if not its detailed workings.
There is another set that consists of the signal fields that can be expressed using the form for the nonlinear interaction used in the measurement.
There is only one possible signal field that both has the correct intensity to match the data trace and fits the mathematical form dictated by the nonlinear interaction.
To be in that set, the magnitude squared of the signal field has to match the intensity measured by the trace.
The closest point in the data constraint set is found by replacing the magnitude of
A general expression for the distance between the current point and any point in the mathematical constraint set is created, and then that expression is minimized by taking the gradient of that distance with respect the current field guess.
A second FROG trace is usually constructed mathematically from the solution and compared with the original measurement.
One important feature of a FROG measurement is that many more data points are collected than are strictly necessary to find the pulse electric field.
Thus the importance of each individual data point being absolutely correct is greatly reduced.
This is very helpful for real-world measurements that can be affected by detector noise and systematic errors.
Noise is extremely unlikely to affect the measured trace in a way that could be confused with a physical phenomenon in the pulse.
The FROG algorithm tends to “see through” these effects due to the amount of extra information available and the use of a mathematical form constraint in finding a solution.
Consequently, significant differences between measured and retrieved FROG traces should be investigated.
The experimental setup may be misaligned, or there may be significant spatio-temporal distortions in the pulse.