Gini coefficient
[5] For OECD countries in the late 20th century, considering the effect of taxes and transfer payments, the income Gini coefficient ranged between 0.24 and 0.49, with Slovakia being the lowest and Mexico the highest.
Secondly, Gini observed that his proposed ratio can be also achieved by improving methods already introduced by Lorenz, Chatelain, or Séailles.
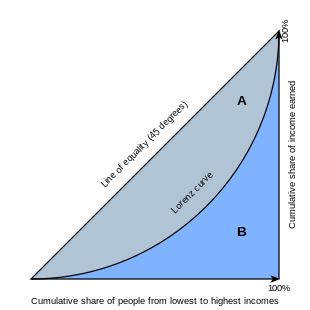
[23] Assuming non-negative income or wealth for all, the Gini coefficient's theoretical range is from 0 (total equality) to 1 (absolute inequality).
[24] An alternative approach is to define the Gini coefficient as half of the relative mean absolute difference, which is equivalent to the definition based on the Lorenz curve.
For example, (taking y to indicate the income or wealth of a person or household): The Gini coefficient can also be considered as half the relative mean absolute difference.
In that case, the Gini coefficient can be approximated using various techniques for interpolating the missing values of the Lorenz curve.
The model then expresses the rank (dependent variable) as the sum of a constant A and a normal error term whose variance is inversely proportional to yk: Thus, G can be expressed as a function of the weighted least squares estimate of the constant A and that this can be used to speed up the calculation of the jackknife estimate for the standard error.
[6][46][47] For OECD countries over the 2008–2009 period, the Gini coefficient (pre-taxes and transfers) for a total population ranged between 0.34 and 0.53, with South Korea the lowest and Italy the highest.
According to UNICEF, Latin America and the Caribbean region had the highest net income Gini index in the world at 48.3, on an unweighted average basis in 2008.
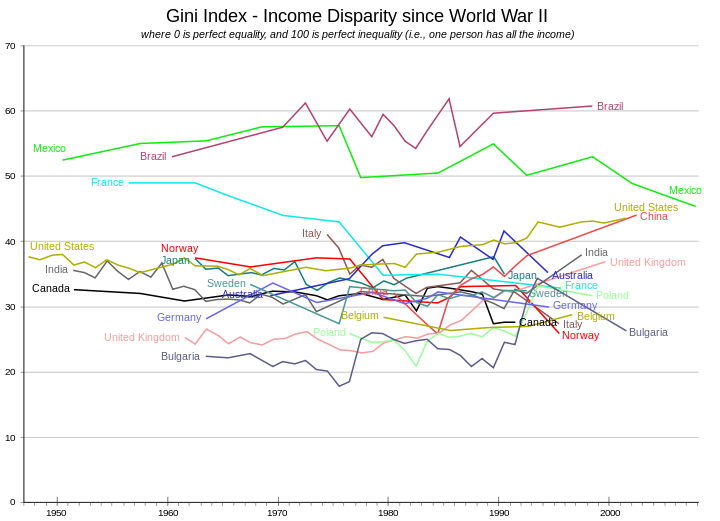
This trend appears to have peaked and begun a reversal with rapid economic growth in emerging economies, particularly in the large populations of BRIC countries.
Developing countries like Brazil have also improved basic services like health care, education, and sanitation; others like Chile and Mexico have enacted more progressive tax policies.
[55] The Gini coefficient is widely used in fields as diverse as sociology, economics, health science, ecology, engineering, and agriculture.
Kovacevic, in a review of the Gini opportunity coefficient, explained that the coefficient estimates how well a society enables its citizens to achieve success in life where the success is based on a person's choices, efforts and talents, not their background defined by a set of predetermined circumstances at birth, such as gender, race, place of birth, parent's income and circumstances beyond the control of that individual.
Shorrocks index is calculated in several different ways, a common approach being from the ratio of income Gini coefficients between short-term and long-term for the same region or country.
[67] A 2010 study using social security income data for the United States since 1937 and Gini-based Shorrock's indices concludes that income mobility in the United States has had a complicated history, primarily due to the mass influx of women into the American labor force after World War II.
When men and women are considered together, the Gini coefficient-based Shorrocks index trends imply long-term income inequality has been substantially reduced among all workers, in recent decades for the United States.
The Gini coefficient of a developing country can rise (due to increasing inequality of income) even when the number of people in absolute poverty decreases.
[73] Similarly, computational social scientist Fabian Stephany illustrates that income inequality within the population, e.g., in specific socioeconomic groups of same age and education, also remains undetected by conventional Gini indices.
By ignoring wealth (except as it contributes to income), the Gini can create the appearance of inequality when the people compared are at different stages in their life.
For example, taking the world economy as a whole and income distribution for all human beings, different scholars estimate the global Gini index to range between 0.61 and 0.68.
[80] Billionaire Thomas Kwok claimed the income Gini coefficient for Hong Kong has been high (0.434 in 2010[72]), in part because of structural changes in its population.
[79] Household money income distribution for the United States, summarized in Table C of this section, confirms that this issue is not limited to just Hong Kong.
Because of this, factors such as age distribution within a population and mobility within income classes can create the appearance of inequality when none exist, taking into account demographic effects.
Inaccuracies in assign monetary value to income in kind reduce the accuracy of Gini as a measurement of true inequality.
These forms of income tend to accrue to poor segments of populations in emerging and transitional economy countries such as those in sub-Saharan Africa, Latin America, Asia, and Eastern Europe.
There is a summary measure of the diagnostic ability of a binary classifier system that is also called the Gini coefficient, which is defined as twice the area between the receiver operating characteristic (ROC) curve and its diagonal.
It was developed 9 years before the Gini coefficient, which quantifies the extent to which the Lorenz curve deviates from the perfect equality line (with slope of 1).
Other data does not directly document variations in wealth or income but are known to reflect inequality, such as the ratio of rents to wages or of labor to capital.
[99] In engineering, it has been used to evaluate the fairness achieved by Internet routers in scheduling packet transmissions from different flows of traffic.
[103] A 2016 peer-reviewed study titled Employing the Gini coefficient to measure participation inequality in treatment-focused Digital Health Social Networks[104] illustrated that the Gini coefficient was helpful and accurate in measuring shifts in inequality, however as a standalone metric it failed to incorporate overall network size.

-
<30
-
30-35
-
35-40
-
40-45
-
45-50
-
50+