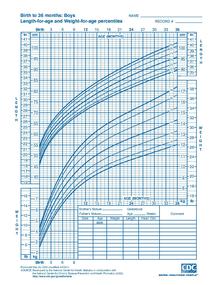
Growth chart
When a child deviates from his or her previously established growth curve, investigation into the cause is generally warranted.
Parameters used to analyze growth charts include weight velocity (defined as rate of change in weight over time), height velocity (defined as rate of change in stature over time), and whether someone's growth chart crosses percentiles.
Growth charts can also be compiled with a portion of the population deemed to have been raised in more or less ideal environments, such as nutrition that conforms to pediatric guidelines, and no maternal smoking.
The 1977 growth chart was subsequently used by the World Health Organization for dissemination to healthcare systems abroad.
In order to accommodate for heterogenous populations internationally, the WHO made an effort to gather data from different regions in every continent.
Data used to calculate the CDC's growth chart percentiles was accumulated periodically since the 1960s by the National Health and Nutrition Examination Survey.
Alternatively, TH can be expressed in standard deviation scores (SDS), with TH_SDS = (mother’s height_SDS + father’s height_SDS) / 2.
[6] Body mass index (BMI) is a useful quantification that can gauge level of obesity.
The combination of height and weight velocity can indicate underlying disease of genetic origin, endocrine cause, and/or delayed growth.
Constitutional growth delays are marked by low height and weight percentiles as early as the first 4–6 months following birth.