Huygens (spacecraft)
When the mission was planned, it was not yet certain whether the landing site would be a mountain range, a flat plain, an ocean, or something else, and it was thought that analysis of data from Cassini would help to answer these questions.
Assuming the landing site could be non-solid, Huygens was designed to survive the impact, splash down on a liquid surface on Titan, and send back data for several minutes under these conditions.
[7] These checkouts followed preprogrammed descent scenario sequences as closely as possible, and the results were relayed to Earth for examination by system and payload experts.
Very large radio telescopes on Earth were also listening to Huygens's 10-watt transmission using the technique of very long baseline interferometry and aperture synthesis mode.
At 11:25 CET on 14 January, the Robert C. Byrd Green Bank Telescope (GBT) in West Virginia detected the carrier signal from Huygens.
In addition to the GBT, eight of the ten telescopes of the continent-wide VLBA in North America, located at Pie Town and Los Alamos, New Mexico; Fort Davis, Texas; North Liberty, Iowa; Kitt Peak, Arizona; Brewster, Washington; Owens Valley, California; and Mauna Kea, Hawaii, also listened for the Huygens signal.
It was expected that through analysis of the Doppler shifting of Huygens's signal as it descended through the atmosphere of Titan, wind speed and direction could be determined with some degree of accuracy.
[9] At the landing site there were indications of pebbles of water ice scattered over an orange surface, the majority of which is covered by a thin haze of methane.
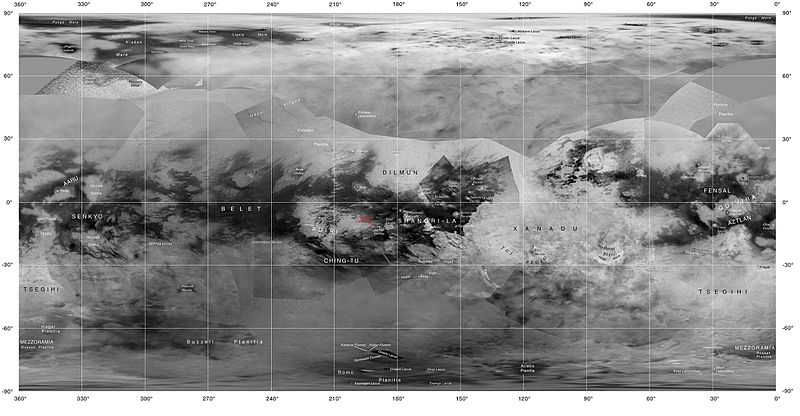
The initial photos of Titan before landing showed what appeared to be large drainage channels crossing the lighter colored mainland into a dark sea.
The likely supplier in dry desert areas is probably underground aquifers; in other words, the arid equatorial regions of Titan contain "oases".
[13] Thermometers indicated that heat left Huygens so quickly that the ground must have been damp, and one image shows light reflected by a dewdrop as it falls across the camera's field of view.
So Titan's weather is expected to feature torrential downpours causing flash floods, interspersed by decades or centuries of drought.
At ground level, the Earth-based doppler shift and VLBI measurements show gentle winds of a few metres per second, roughly in line with expectations.
Its visible and infrared spectrometers and violet photometers measured the up- and downward radiant flux from an altitude of 145 km (90 mi) down to the surface.
Aided by the slowly spinning probe they would build up a full mosaic of the landing site, which, surprisingly, became clearly visible only below 25 km (16 mi) altitude.
DISR was developed at the Lunar and Planetary Laboratory at the University of Arizona under the direction of Martin Tomasko, with several European institutes contributing to the hardware.
The ACP experiment drew in aerosol particles from the atmosphere through filters, then heated the trapped samples in ovens (using the process of pyrolysis) to vaporize volatiles and decompose the complex organic materials.
The instrument was designed so that if the surface were liquid, the sounder would measure the speed of sound in the "ocean" and possibly also the subsurface structure (depth).
During descent, measurements of the speed of sound gave information on atmospheric composition and temperature, and an accelerometer recorded the deceleration profile at impact, indicating the hardness and structure of the surface.
Long after launch, a few persistent engineers discovered that the communication equipment on Cassini had a potentially fatal design flaw, which would have caused the loss of all data transmitted by Huygens.
Some engineers, most notably ESA ESOC employees Claudio Sollazzo and Boris Smeds, felt uneasy about the fact that, in their opinion, this feature had not been tested before launch under sufficiently realistic conditions.
[24] This was because under the original flight plan, when Huygens was to descend to Titan, it would have accelerated relative to Cassini, causing the Doppler shift of its signal to vary.
Huygens detached a month later than originally planned (December 2004 instead of November) and approached Titan in such a way that its transmissions travelled perpendicular to its direction of motion relative to Cassini, greatly reducing the Doppler shift.
[24] The trajectory change overcame the design flaw for the most part, and data transmission succeeded, although the information from one of the two radio channels was lost due to an unrelated error.
Huygens was programmed to transmit telemetry and scientific data to the Cassini orbiter for relay to Earth using two redundant S-band radio systems, referred to as Channel A and B, or Chain A and B.
Channel A was the sole path for an experiment to measure wind speeds by studying tiny frequency changes caused by Huygens's motion.
The fact that Huygens rotated in the opposite direction than planned delayed the creation of surface mosaics from the raw data by the project team for many months.
This was possible, because the European Space Agency approved the publication of the DISR raw images and gave the permission for citizen scientists to present their results on the internet.
[32][33] While the media liked to present the story of amateurs outperforming the professionals,[28][31][32] most of the participants understood themselves as citizen scientists, and the driving force behind their work was a desire to find out and show as much as possible of the hitherto unknown surface of Titan.
[34] Another project worked with the Huygens DISR data for several months until virtually all images with recognizable structures were able to be assigned to their correct position, resulting in comprehensive mosaics and panoramas.


Huygens · Titan · Saturn