Hypsometric tints
In his map of central Italy, c.1503, Leonardo da Vinci introduced the cartographic convention of using colored chalk to indicate changes in elevation.
Matthew Fontaine Maury published this map in 1853 in Explanations and Sailing Directions to Accompany the Wind and Current Charts.
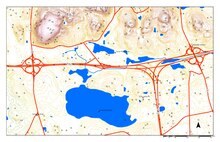
Each pixel in the DEM is assigned a color which corresponds to the exact elevation at that location, so it is more precise than discrete hypsometric tinting.
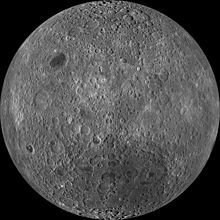
Similar to false-color imagery, hypsometric tints can be used to make geographic information more accessible, as with this image of lunar topography.
... With hypsometric tints, the result is often a map with pleasing colors that blend softly into one another in an orderly fashion, a design trait that people find attractive, even if they don't necessarily know or care about elevations.