Lacunarity
Lacunarity, from the Latin lacuna, meaning "gap" or "lake", is a specialized term in geometry referring to a measure of how patterns, especially fractals, fill space, where patterns having more or larger gaps generally have higher lacunarity.
Beyond being an intuitive measure of gappiness, lacunarity can quantify additional features of patterns such as "rotational invariance" and more generally, heterogeneity.
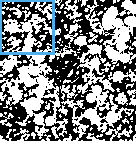
[1][2][3] This is illustrated in Figure 1 showing three fractal patterns.
The earliest reference to the term in geometry is usually attributed to Benoit Mandelbrot, who, in 1983 or perhaps as early as 1977, introduced it as, in essence, an adjunct to fractal analysis.
[4] Lacunarity analysis is now used to characterize patterns in a wide variety of fields and has application in multifractal analysis[5][6] in particular (see Applications).
In many patterns or data sets, lacunarity is not readily perceivable or quantifiable, so computer-aided methods have been developed to calculate it.
As a measurable quantity, lacunarity is often denoted in scientific literature by the Greek letters
but it is important to note that there is no single standard and several different methods exist to assess and interpret lacunarity.
One well-known method of determining lacunarity for patterns extracted from digital images uses box counting, the same essential algorithm typically used for some types of fractal analysis.
[1][4] Similar to looking at a slide through a microscope with changing levels of magnification, box counting algorithms look at a digital image from many levels of resolution to examine how certain features change with the size of the element used to inspect the image.
Basically, the arrangement of pixels is measured using traditionally square (i.e., box-shaped) elements from an arbitrary set of
is placed successively on the image, in the end covering it completely, and each time it is laid down, the number of pixels that fall within the box is recorded.
[3][7] Figure 2 illustrates both types of box counting.
, that the data can be gathered over, which can have varying effects on the measured distribution of pixels.
[5][note 2] Equation 1 shows the basic method of calculating
: Alternatively, some methods sort the numbers of pixels counted into a probability distribution having
has been assessed in several ways including by using the variation in or the average value of
[1][5][7][8] Lacunarity analyses using the types of values discussed above have shown that data sets extracted from dense fractals, from patterns that change little when rotated, or from patterns that are homogeneous, have low lacunarity, but as these features increase,[clarification needed] so generally does lacunarity.
In some instances, it has been demonstrated that fractal dimensions and values of lacunarity were correlated,[1] but more recent research has shown that this relationship does not hold for all types of patterns and measures of lacunarity.
[5] Indeed, as Mandelbrot originally proposed, lacunarity has been shown to be useful in discerning amongst patterns (e.g., fractals, textures, etc.)
that share or have similar fractal dimensions in a variety of scientific fields including neuroscience.
According to this method, the curve itself can be analyzed visually, or the slope at
[3][7] Because they tend to behave in certain ways for respectively mono-, multi-, and non-fractal patterns,
lacunarity plots have been used to supplement methods of classifying such patterns.
[5][8] To make the plots for this type of analysis, the data from box counting first have to be transformed as in Equation 9: This transformation avoids undefined values, which is important because homogeneous images will have
, homogeneous images have a slope of 0, corresponding intuitively to the idea of no rotational or translational invariance and no gaps.
is the number of filled data points in the box and
Another proposed way of assessing lacunarity using box counting, the Prefactor method, is based on the value obtained from box counting for the fractal dimension (
is particularly affected by image size and the way data are gathered, especially by the lower limit of
The final measure is calculated as shown in Equations 11 through 13:[1][4] Below is a list of some fields where lacunarity plays an important role, along with links to relevant research illustrating practical uses of lacunarity.