Laffer curve
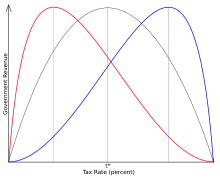
In economics, the Laffer curve illustrates a theoretical relationship between rates of taxation and the resulting levels of the government's tax revenue.
[7] Ibn Khaldun, a 14th-century philosopher, wrote in his work The Muqaddimah: "It should be known that at the beginning of the dynasty, taxation yields a large revenue from small assessments.
Laffer states that he did not invent the concept, citing numerous antecedents, including the Muqaddimah by 14th-century Islamic scholar Ibn Khaldun,[7][8] John Maynard Keynes[7] and Adam Smith.
[9][7] In this meeting, Laffer, arguing against President Gerald Ford's tax increase, reportedly sketched the curve on a napkin to illustrate the concept.
Ferdinando Galiani wrote in Della Moneta (1751) that "It is an enormous error ... to believe that an impost always yields more revenue as it becomes heavier".
David Hume expressed similar arguments in his essay Of Taxes in 1756, as did fellow Scottish economist Adam Smith twenty years later.
[14] The Democratic party embraced this argument in the 1880s when high revenue from import tariffs raised during the Civil War (1861–1865) led to federal budget surpluses.
The Republican party, which was then based in the protectionist industrial Northeast, argued that cutting rates would lower revenues.
Mellon was one of the wealthiest people in the United States, the third-highest income-tax payer in the mid-1920s, behind John D. Rockefeller and Henry Ford.
Personal income tax receipts rose from US$719 million in 1921 to over US$1 billion in 1929, an average increase of 4.2% per year over an 8-year period, which supporters attribute to the rate cut.
[19] In 2017, Jacob Lundberg of the Uppsala University estimated Laffer curves for 27 OECD countries, with top income-tax rates maximising tax revenue ranging from 60 to 61% (Austria, Luxembourg, Netherlands, Poland, Sweden) to 74–76% (Germany, Switzerland, UK, US).
[22] In the early 1980s, Edgar L. Feige and Robert T. McGee developed a macroeconomic model from which they derived a Laffer curve.
According to the model, the shape and position of the Laffer curve depend upon the strength of supply side effects, the progressivity of the tax system and the size of the unobserved economy.
[24][25][26] Economist Paul Pecorino presented a model in 1995 that predicted the peak of the Laffer curve occurred at tax rates around 65%.
[27] A draft paper by Y. Hsing looking at the United States economy between 1959 and 1991 placed the revenue-maximizing average federal tax rate between 32.67% and 35.21%.
[28] A 1981 article published in the Journal of Political Economy presented a model integrating empirical data that indicated that the point of maximum tax revenue in Sweden in the 1970s would have been 70%.
[23] A 2005 study concluded that with the exception of Sweden, no major OECD country could increase revenue by reducing the marginal tax rate.
[30] The New Palgrave Dictionary of Economics reports that a comparison of academic studies yields a range of revenue maximizing rates that centers around 70%.
In their 2018 Econometrica paper, Miravete, Seim, and Thurk, show that in non-competitive markets, the strategic pricing response of firms is important to consider when estimating the Laffer curve.
In 2005, the United States Congressional Budget Office (CBO) released a paper called "Analyzing the Economic and Budgetary Effects of a 10 Percent Cut in Income Tax Rates."
[33][34] In 2019, economists at the Joint Committee on Taxation revisited the macroeconomic and budgetary response to the stylized 10% reduction in statutory ordinary income tax rates, but from the levels set by P.L.
Laffer has presented the examples of Russia and the Baltic states, which instituted a flat tax with rates lower than 35% around the same time that their economies started growing.
Supply-side economists use it to argue that it is possible to generate higher revenues by cutting tax rates, but evidence does not appear to support this.
The way they talked, they seemed to expect that once the supply-side tax cut was in effect, additional revenue would start to fall, manna-like, from the heavens.
For example, economist John Kenneth Galbraith believed that the Reagan administration actively used the Laffer curve "to lower taxes on the affluent".
[53] The Congressional Budget Office has estimated that extending the Bush tax cuts of 2001–2003 beyond their 2010 expiration would increase deficits by $1.8 trillion over the following decade.
He also noted that there can be special circumstances in which economic activity can continue for a period at a near 100% taxation rate (for example, in war economy).
[59][60] This led supply-siders to advocate large reductions in marginal income and capital gains tax rates to encourage greater investment, which would produce more supply.
However, in some theoretical models, the Laffer curve can be discontinuous, leading to an inability to devise a revenue-maximizing tax rate solution.
Actual systems of public finance are more complex, and there is serious doubt about the relevance of considering a single marginal tax rate.