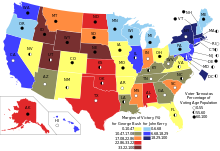
Map coloring
The choropleth map provides an easy way to visualize how a measurement varies across a geographic area or it shows the level of variability within a region.
Displaying the data in different hues can greatly affect the understanding or feel of the map.
Likewise, using assumed skin colors to show racial or ethnic patterns will likely cause offense.
Carefully choosing colors ensures that the map is intuitive and easy to read.
Colors can also be used to produce three-dimensional effects from two-dimensional maps, either by explicit color-coding of the two images intended for different eyes, or by using the characteristics of the human visual system to make the map look three-dimensional.