Cartographic design
Most map makers served several years as an apprentice, learning the skills of the master, with little room for innovation other than adapting to changing production technology.
As late as 1948, Erwin Raisz's General Cartography, the standard English textbook on the subject, reads as a set of instructions of how to construct maps in keeping with tradition, with very little reflection on why it is done that way.
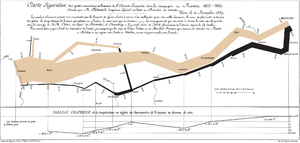
[3] This was despite the fact that Raisz himself was a very creative designer, developing techniques as varied as cartograms and a style of Terrain depiction on physiographic maps that few have been able to replicate.
[4] Advances in cartographic production technology in the 20th century, especially the advent and widespread availability of color Offset printing, then a multitude of advances spurred on by World War II, such as Photolithography, gave cartographers a larger palette of design options, and made it easier to creatively innovate.
This was synchronized with the widespread expansion of higher education, during which most cartography training transitioned from an apprenticeship to a college degree (typically using Raisz's textbook in America).
The new generation of cartography professionals and professors began to reflect on why some maps seemed to be better (in beauty and function) than others, and to think of ways to improve design.
"[2] Since the 1950s, a significant focus of cartography as an academic discipline has been the cartographic communication school of thought,[6] seeking to improve design standards through increased scientific understanding of how maps are perceived and used, typically based on cognate disciplines such as psychology (especially perception, Gestalt psychology, and psychophysical experimentation), Human vision, and geography.
This focus began to be challenged towards the end of the 1980s by the study of critical cartography, which drew attention to the influence of social and political forces on map design.
Most notably, GIS and graphics software not only makes it easier and faster to create a map, but it facilitates a non-linear editing process that is more flexible than in the days of manual cartography.
This leads the user to take action and draw conclusions based on the information that they find on the map.
In turn, the practical value of maps has gained aesthetic appeal, favoring those that exude a feeling of being "professional," "authoritative," "well-crafted," "clear," or "informative."
The principal task of the artist, be he a painter or a map designer, consists of translating the relevant aspects of the message into the expressive qualities of the medium in such a way that the information comes across as a direct impact of perceptual forces.
A critical examination of the factors influencing aesthetic decisions in contemporary mapmaking.Robinson codified the mapmaker's understanding that a map must be designed foremost with consideration to the audience and its needs, stating that from the very beginning of mapmaking, maps "have been made for some particular purpose or set of purposes".
In order to convey the message of the map, the creator must design it in a manner which will aid the reader in the overall understanding of its purpose.
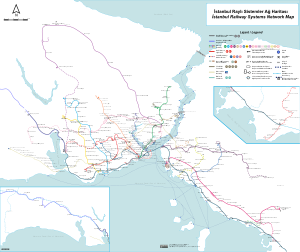
Therefore, there are now a huge variety of different styles and types of map – for example, one area which has evolved a specific and recognisable variation are those used by public transport organisations to guide passengers, namely urban rail and metro maps, many of which are loosely based on 45 degree angles as originally perfected by Harry Beck and George Dow.
Unlike cognate disciplines such as Graphic design, Cartography is constrained by the fact that geographic phenomena are where and what they are.
[21] A significant part of this transformation is generalization, a set of procedures for adjusting the amount of detail (geometry and attributes) in datasets to be appropriate for a given map.
For example, a 2mm thick highway symbol on a map at a scale of 1:1,000,000 occupies a space 2 km wide, leaving no room for roadside features.
Most map projections are implemented using mathematical formulas and computer algorithms based on geographic coordinates (latitude, longitude).
More recently, cartographers have experimented with a wide variety of interrupted arrangements of projections, including homolosine and polyhedral maps.
[25] Jacques Bertin, in Sémiologie Graphique (1967), introduced a system of codifying graphical elements (including map symbols) that has been a part of the canon of Cartographic knowledge ever since.
While many of these decisions are specific to the particular map, functional label placement tends to follow a number of rules that have been developed through cartographic research,[29] which has led to automated algorithms to place them automatically, to a reasonable degree of quality.
Sometimes multiple transliteration systems exist; for example, the Yemeni city of المخا is written variously in English as Mocha, Al Mukha, al-Makhā, al-Makha, Mocca and Moka.
While some of these ideas were posited by Arthur H. Robinson in The Look of Maps (1952),[5] Borden Dent was likely the first to approach it in a systematic way in 1972, firmly within the Cartographic Communication school of thought.