Scale (map)
This simple concept is complicated by the curvature of the Earth's surface, which forces scale to vary across a map.
If the region of the map is small enough to ignore Earth's curvature, such as in a town plan, then a single value can be used as the scale without causing measurement errors.
Ancient Chinese surveyors and cartographers had ample technical resources used to produce maps such as counting rods, carpenter's square's, plumb lines, compasses for drawing circles, and sighting tubes for measuring inclination.
Reference frames postulating a nascent coordinate system for identifying locations were hinted by ancient Chinese astronomers that divided the sky into various sectors or lunar lodges.
[3] The Chinese cartographer and geographer Pei Xiu of the Three Kingdoms period created a set of large-area maps that were drawn to scale.
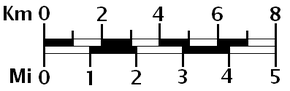
A lexical scale in a language known to the user may be easier to visualise than a ratio: if the scale is an inch to two miles and the map user can see two villages that are about two inches apart on the map, then it is easy to work out that the villages are about four miles apart on the ground.
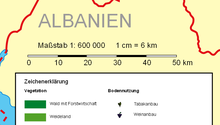
A lexical scale may cause problems if it expressed in a language that the user does not understand or in obsolete or ill-defined units.
For example, a scale of one inch to a furlong (1:7920) will be understood by many older people in countries where Imperial units used to be taught in schools.
However, as explained above, cartographers use the term "large scale" to refer to less extensive maps – those that show a smaller area.
Mapping large areas causes noticeable distortions because it significantly flattens the curved surface of the earth.
If measured only to the nearest metre, then curvature of the earth is undetectable over a meridian distance of about 100 kilometres (62 mi) and over an east-west line of about 80 km (at a latitude of 45 degrees).
As proved by Gauss’s Theorema Egregium, a sphere (or ellipsoid) cannot be projected onto a plane without distortion.
This is commonly illustrated by the impossibility of smoothing an orange peel onto a flat surface without tearing and deforming it.
Comment: this precise distinction between azimuth (on the Earth's surface) and bearing (on the map) is not universally observed, many writers using the terms almost interchangeably.
Conversely isotropic scale factors across the map imply a conformal projection.
The qualification 'small' means that at some given accuracy of measurement no change can be detected in the scale factor over the element.
For example, the equirectangular cylindrical projection may be written as Here we shall adopt the first of these conventions (following the usage in the surveys by Snyder).
Clearly the above projection equations define positions on a huge cylinder wrapped around the Earth and then unrolled.
By comparing the elements on sphere and projection we can immediately deduce expressions for the scale factors on parallels and meridians.
the previous section gives For the calculation of the point scale in an arbitrary direction see addendum.
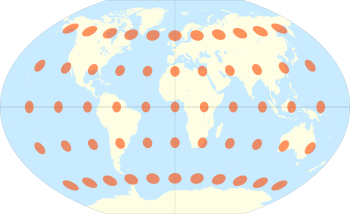
In the Tissot diagram each infinitesimal circular element preserves its shape but is enlarged more and more as the latitude increases.
Lambert's equal area projection maps the sphere to a finite rectangle by the equations[1][2][4] where a,
The vertical and horizontal scales now compensate each other (hk=1) and in the Tissot diagram each infinitesimal circular element is distorted into an ellipse of the same area as the undistorted circles on the equator.
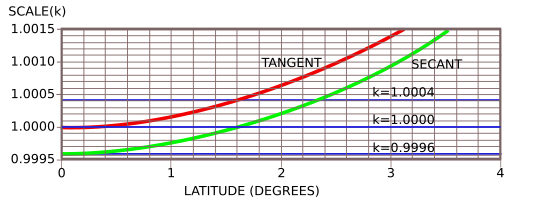
Therefore, the tangent Mercator projection is highly accurate within a strip of width 3.24 degrees centred on the equator.
Note that in both these projections (which are based on various ellipsoids) the transformation equations for x and y and the expression for the scale factor are complicated functions of both latitude and longitude.
As an example, one possible secant Mercator projection is defined by The numeric multipliers do not alter the shape of the projection but it does mean that the scale factors are modified: Thus This is illustrated by the lower (green) curve in the figure of the previous section.
Such narrow zones of high accuracy are used in the UTM and the British OSGB projection, both of which are secant, transverse Mercator on the ellipsoid with the scale on the central meridian constant at
are slightly curved lines approximately 180 km east and west of the central meridian.
For normal cylindrical projections the geometry of the infinitesimal elements gives The relationship between the angles
There is no simple way of transferring a general finite separation to a bar scale and obtaining meaningful results.